June 9, 2026
Ghost buses are everywhere. Meet the benchmark haunting them back.

Matt Fleck
Senior Product Marketing Manager
June 9, 2026
Ghost buses are everywhere. Meet the benchmark haunting them back.
Matt Fleck
June 9, 2026
Ghost buses are everywhere. Meet the benchmark haunting them back.
Matt Fleck
Senior Product Marketing Manager
The bus didn't come, but who’s counting?
Most transit riders have experienced a ghost bus. The ETA counts down: 5 minutes to go… 3 minutes… 1 minute… 0. But no bus, no alert. Riders are left with the quiet frustration of not knowing whether to keep waiting or give up.
These aren't rare edge cases. A vast majority of riders experience ghost buses and similar gaps on a regular basis.
Until now, there hasn't been a standardized way to measure how often these types of gaps are actually happening. Initiatives like the ETA Accuracy Benchmark have gone a long way in quantifying how well agencies are providing real-time predictions worth trusting; but accuracy only describes predictions that are generated. It says nothing about the trips that silently disappear from real-time views entirely.
That's where ETA completeness comes in.
In this piece, we'll take a closer look at what ETA completeness is, why it matters, and a new benchmark to bring this hidden dimension of real-time data into full view.
Want to learn more about your agency’s ETA completeness score? Request a meeting with a Swiftly transit data expert.
Introducing the ETA Completeness Benchmark
For years, Cal-ITP has quietly been measuring the prevalence of ghost buses by logging real-time data completeness in its statewide reporting program. Each month, they publish a report that shows the percentage of scheduled trips at each member agency without at least one prediction, along with other key pieces of the rider experience. This work has given California agencies a clear, neutral view of their ghost buses and how to fix them.
What's been missing, however, is a way to bring that level of visibility to the rest of the industry.
Building on Cal-ITP's existing real-time reporting framework, the ETA Completeness Benchmark establishes the first standardized, industry-wide measure of how often riders receive any real-time information at all. Co-developed with Swiftly, the benchmark offers a neutral, transparent way for agencies to understand where their real-time systems succeed and where information silently disappears.
What is ETA completeness?
ETA completeness fills in an overlooked but essential aspect of the rider experience, providing a critical puzzle piece for understanding the true reliability of real-time information.
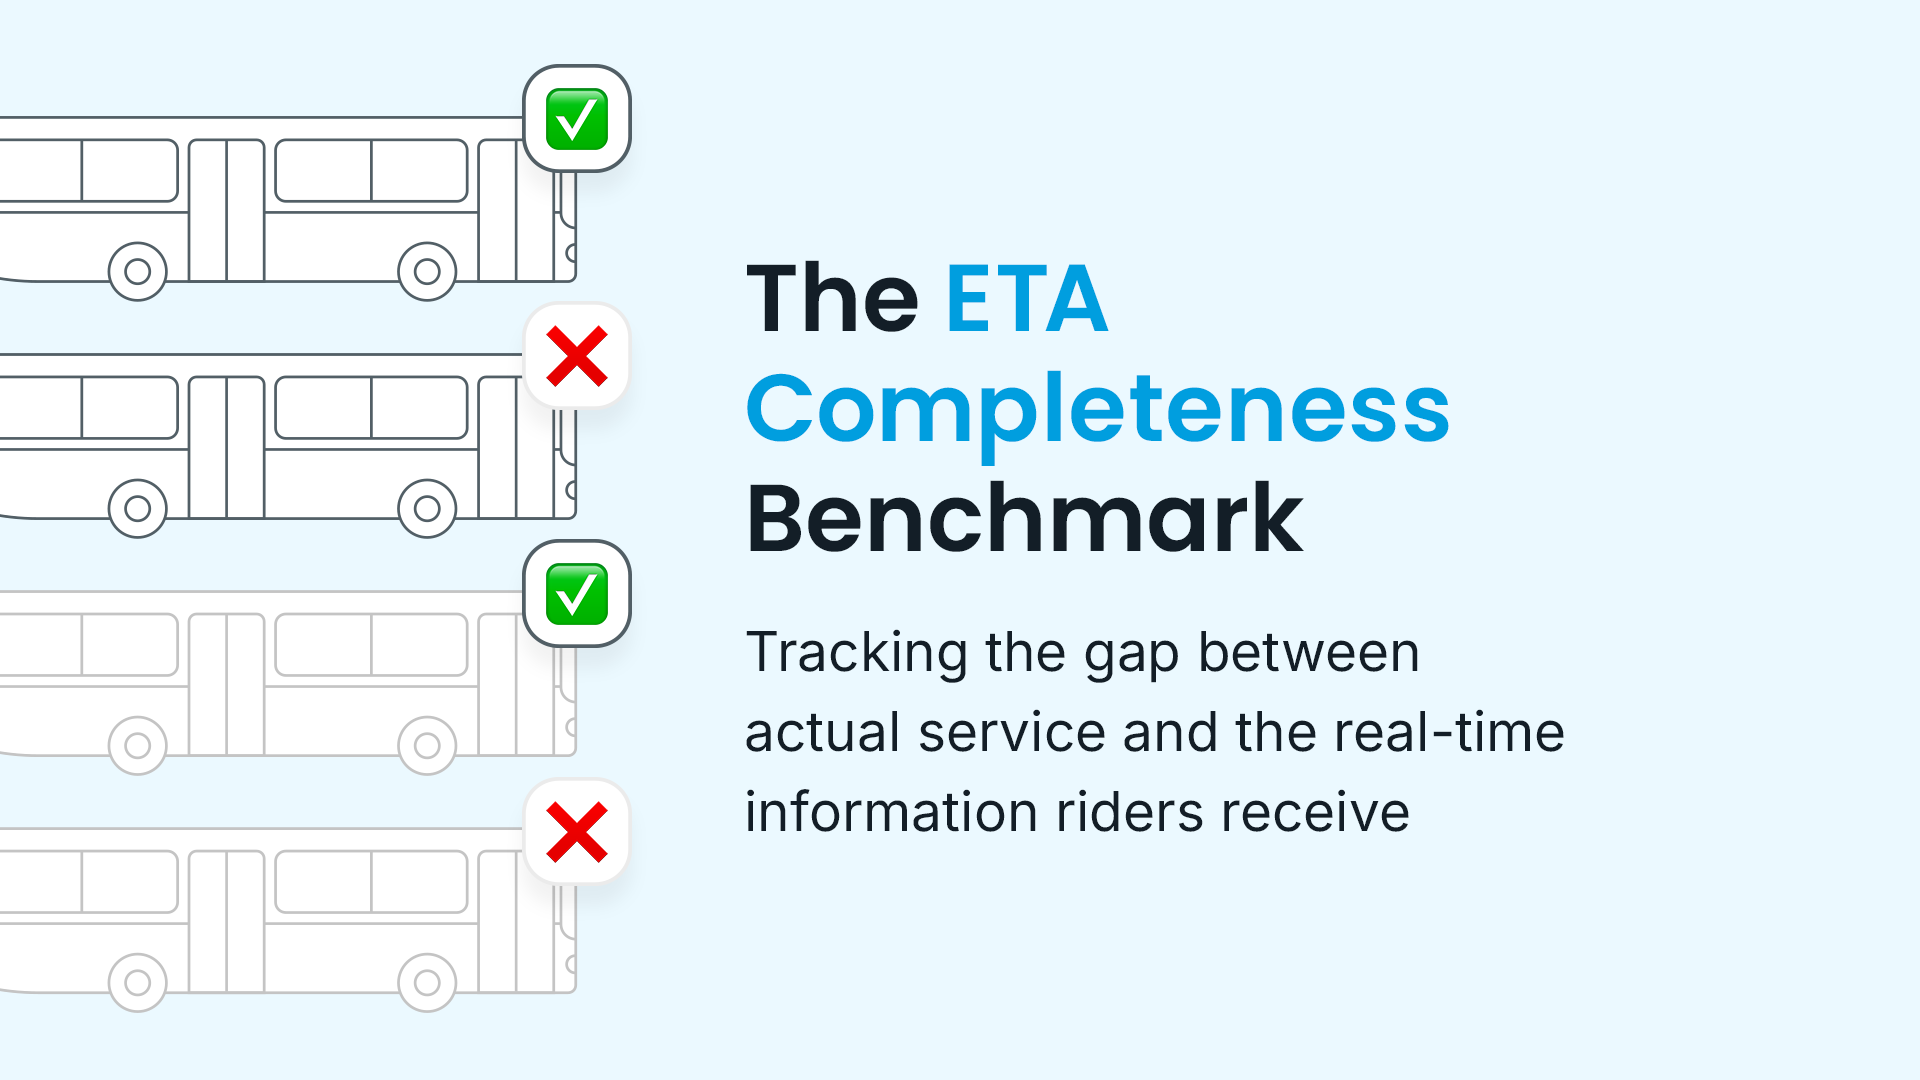
ETA completeness measures how fully a transit agency’s real-time data captures what’s happening on the ground. It captures not just how accurate predictions are, but whether riders receive any real-time information at all.
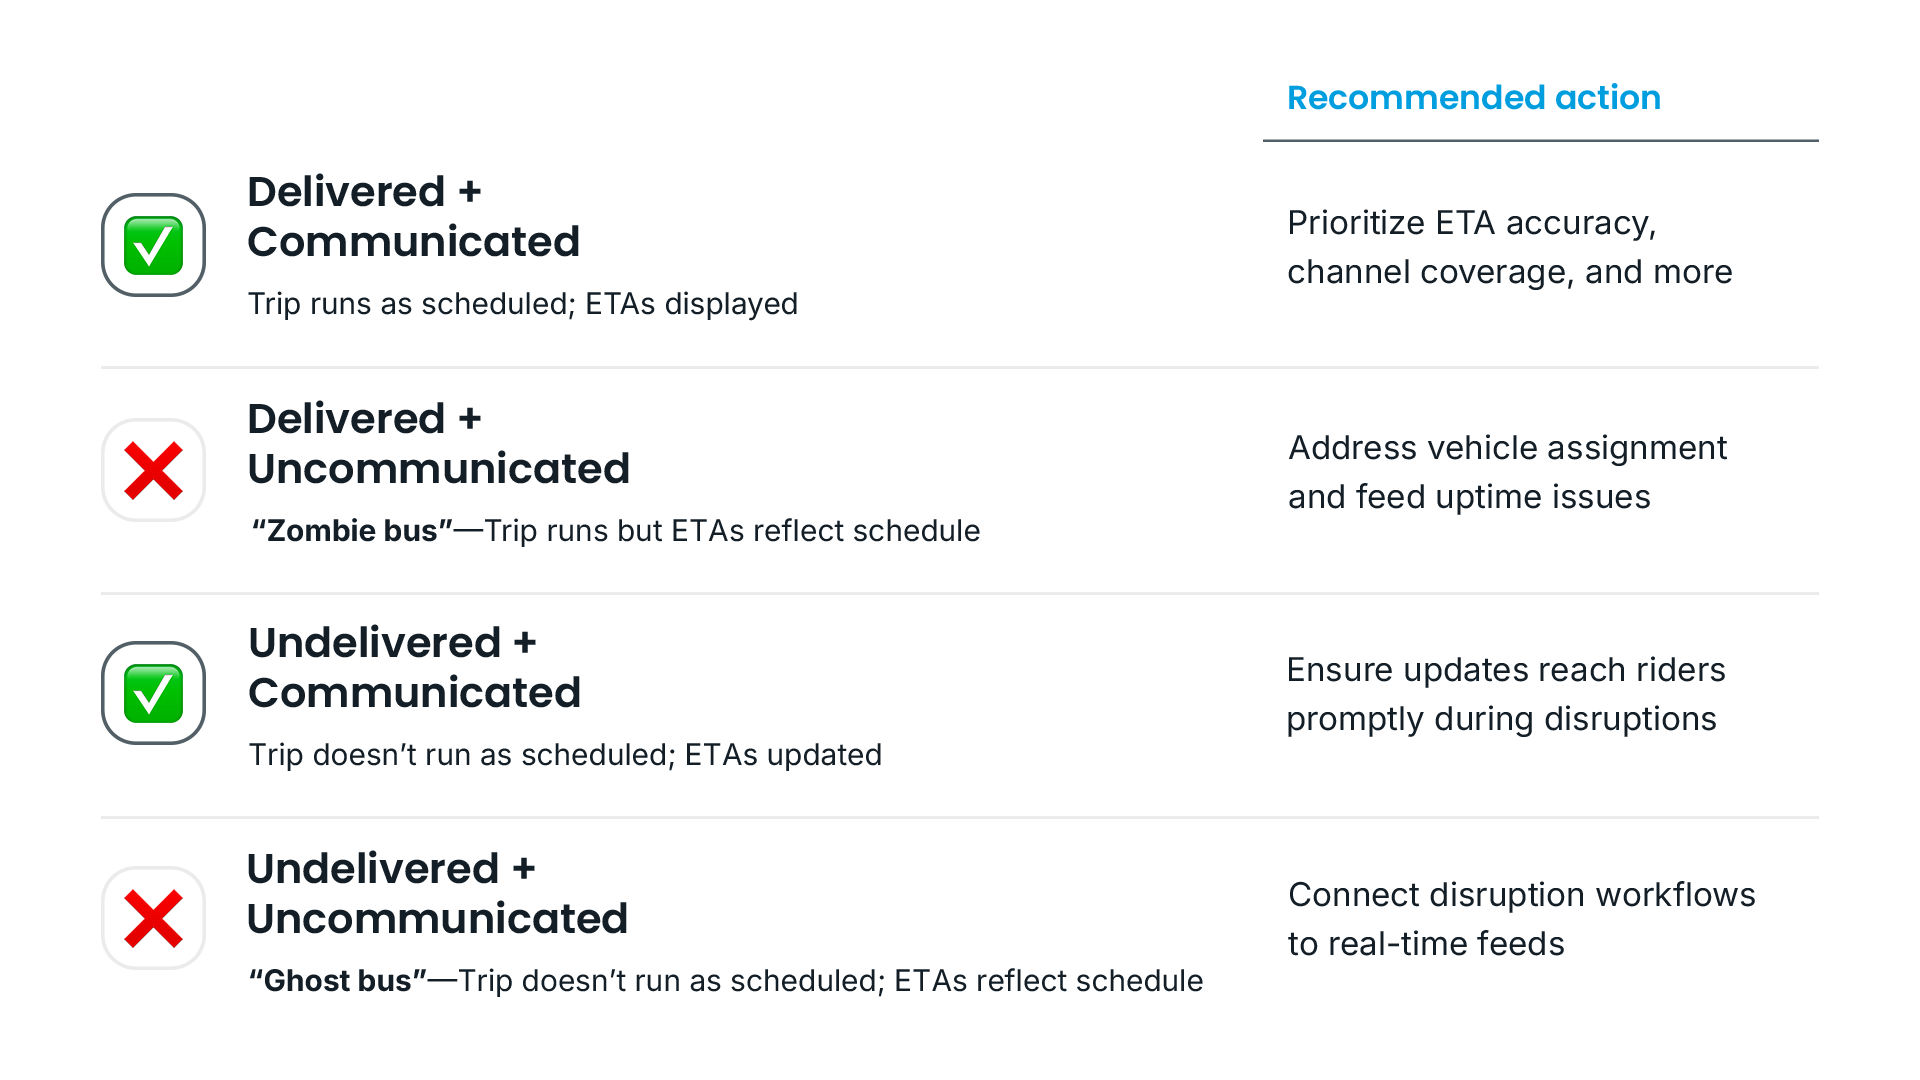
In practice, ETA completeness is measured by analyzing all trip-stop combinations during a given service day, then categorizing each trip-stop into one of four categories:
- ✅ Delivered + communicated: Trips that ran as scheduled and were correctly displayed in real-time feeds. This is the domain of traditional prediction accuracy definitions, including the ETA Accuracy Benchmark.
- ❌ Delivered + uncommunicated: Trips that ran as scheduled but weren't reflected in real-time feeds. The bus showed up, but riders had no way to know it was coming. These are “zombie buses,” service that's invisible to anyone checking an app or sign before heading to the stop.
- ✅ Undelivered + communicated: Trips that didn’t run as scheduled, due to detours, skipped stops, or cancellations, but were correctly reflected in rider apps via proper designations (like CANCELLED or SKIPPED in GTFS-rt feeds). While not ideal, these cases still keep riders informed and are a vast improvement over providing riders with a false assumption of an incoming bus.
- ❌ Undelivered + uncommunicated: Trips that didn't run as scheduled and had no real-time information available to riders at all. These “ghost buses” are the most harmful to the rider experience. Without any update, apps like Google Maps, Transit, and Apple Maps often default to showing scheduled times, even for trips that may not be coming.
Trip-stops where riders received reliable information, whether a real-time prediction (category 1) or a communicated disruption (category 3), are considered “complete.”
Trip-stops where real-time information went dark (categories 2 and 4) are considered “incomplete.”
Taking the percentage of complete trip-stops as a share of all scheduled trip-stops yields an agency's ETA completeness score.
By tracking these signals across millions of trips, agencies can pinpoint exactly where information drops off and use that insight to strengthen trust in their real-time data.
Request a demo
Improve your agency’s ETA completeness score
What does “good” look like?
Just as the ETA Accuracy Benchmark created a shared language around what constitutes an “accurate” prediction, the ETA Completeness Benchmark aims to establish clear thresholds for gauging how “good” an agency’s ETA completeness is.
For context, it’s important to remember what’s at stake. Every bit of missing data represents a moment of broken trust. Every time a rider has a long wait, misses a connection, or scrambles to get to work on time, service issues that might be otherwise forgivable become much harder to forget.
Capturing these stakes requires tight thresholds. A completeness score of 88%, for instance, might seem quite good, but it equates to one in eight trips that are missing real-time information entirely. For a daily commuter, that’s more than once a week waiting for a bus that never comes or arrives without notice. Not exactly a B+.
Of course, nobody’s perfect, so where do we draw the line?
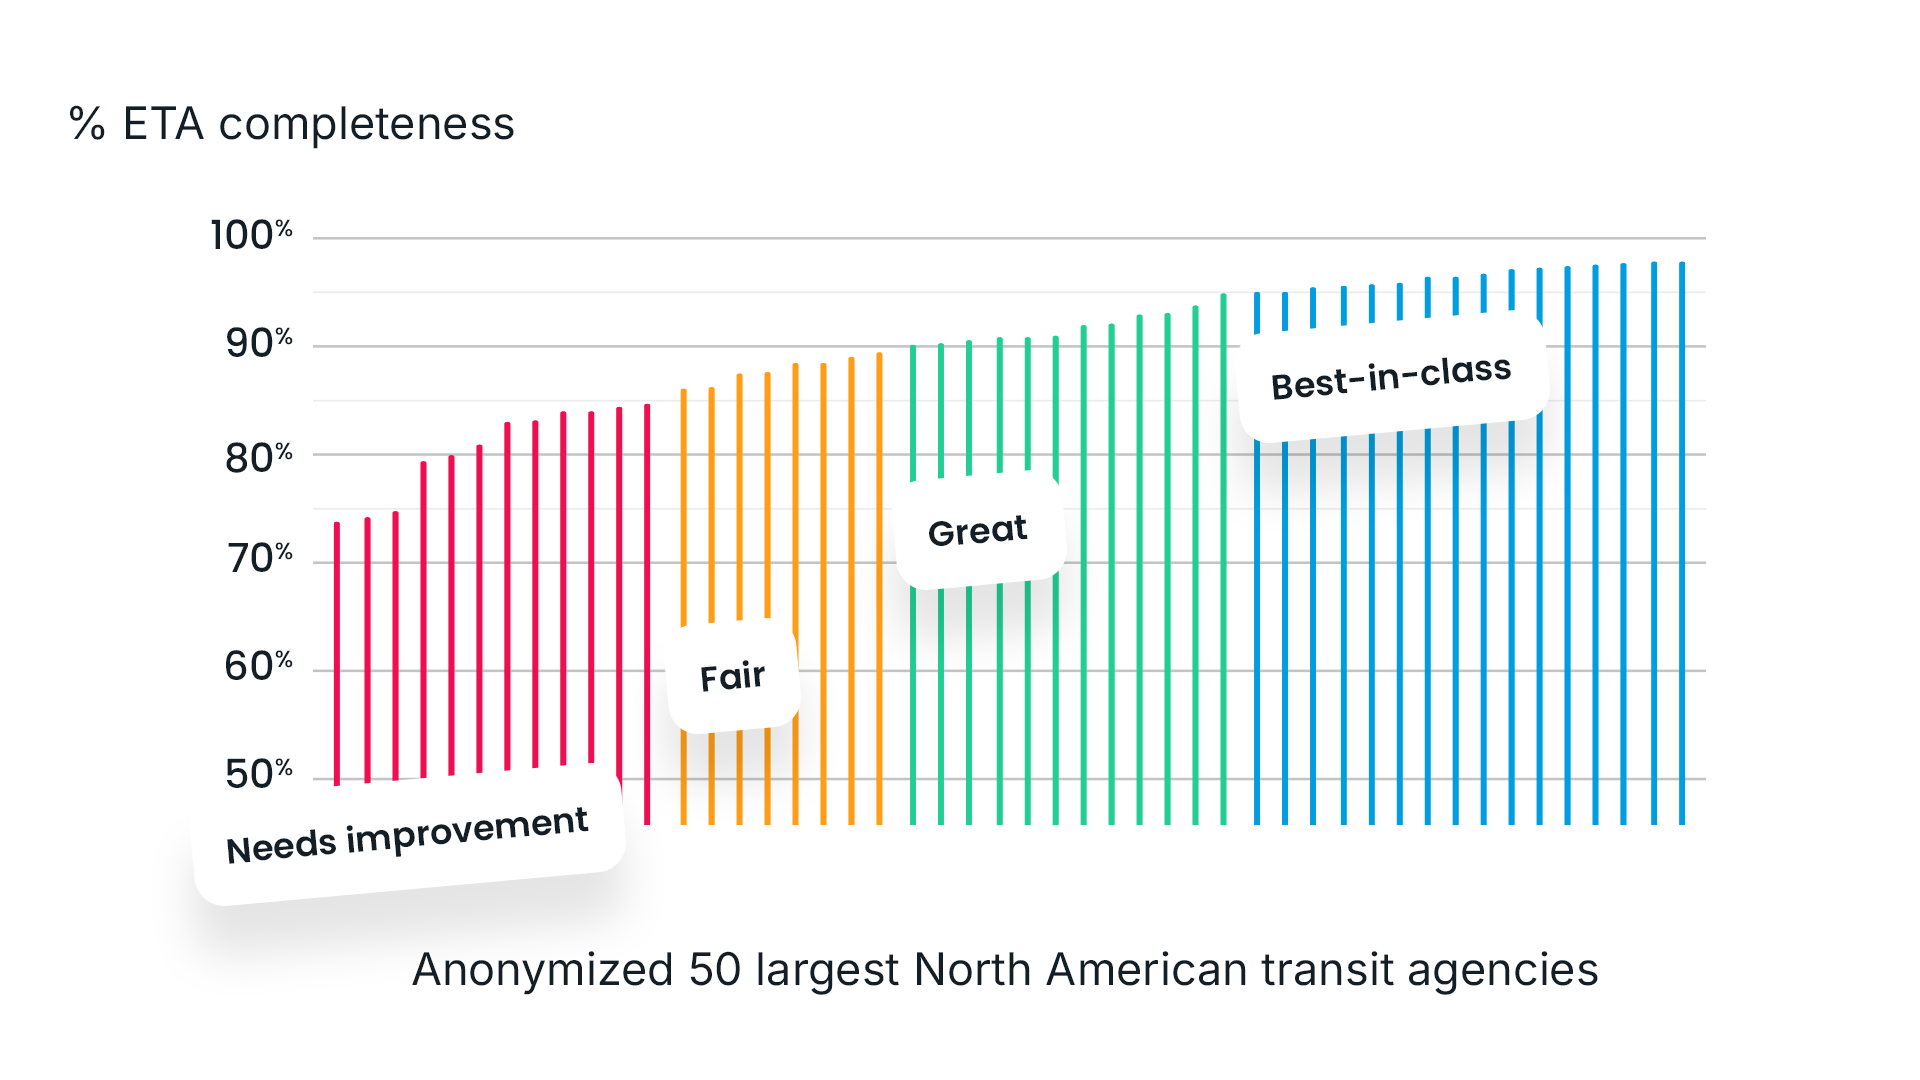
To establish realistic goalposts, we analyzed transit data from hundreds of agencies and looked for natural patterns in completeness scores. From there, we defined “best in class” as a level of performance that was demonstrably achievable, then built remaining categories outward from that baseline.
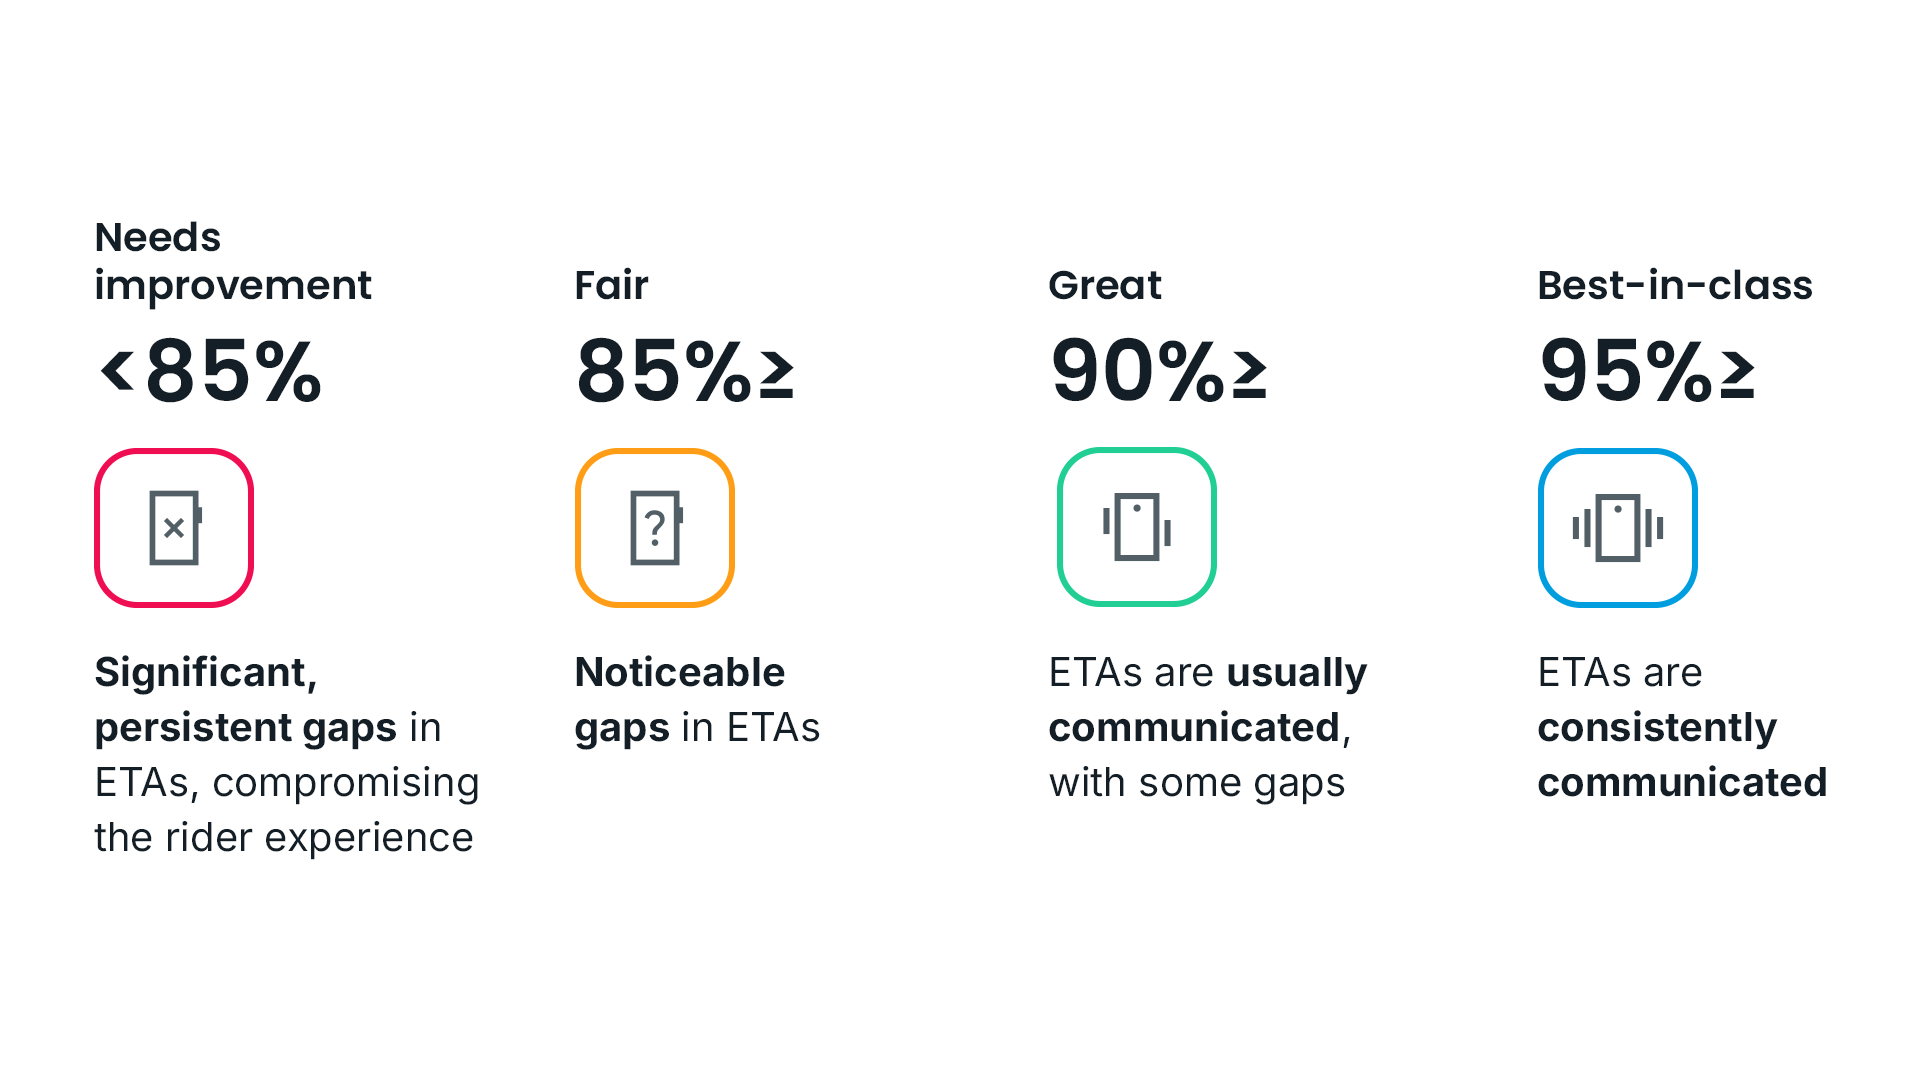
Agencies with completeness scores above 95% represent the top tier of performance; they rarely let trips slip through the cracks. At the 95% mark, gaps in real-time information start to crop up occasionally, but on the whole, ETAs reliably reach riders. At 90%, gaps become frequent enough to risk undermining consistency. And below 85%, missing data appears often enough to meaningfully disrupt how riders plan and perceive their trips.
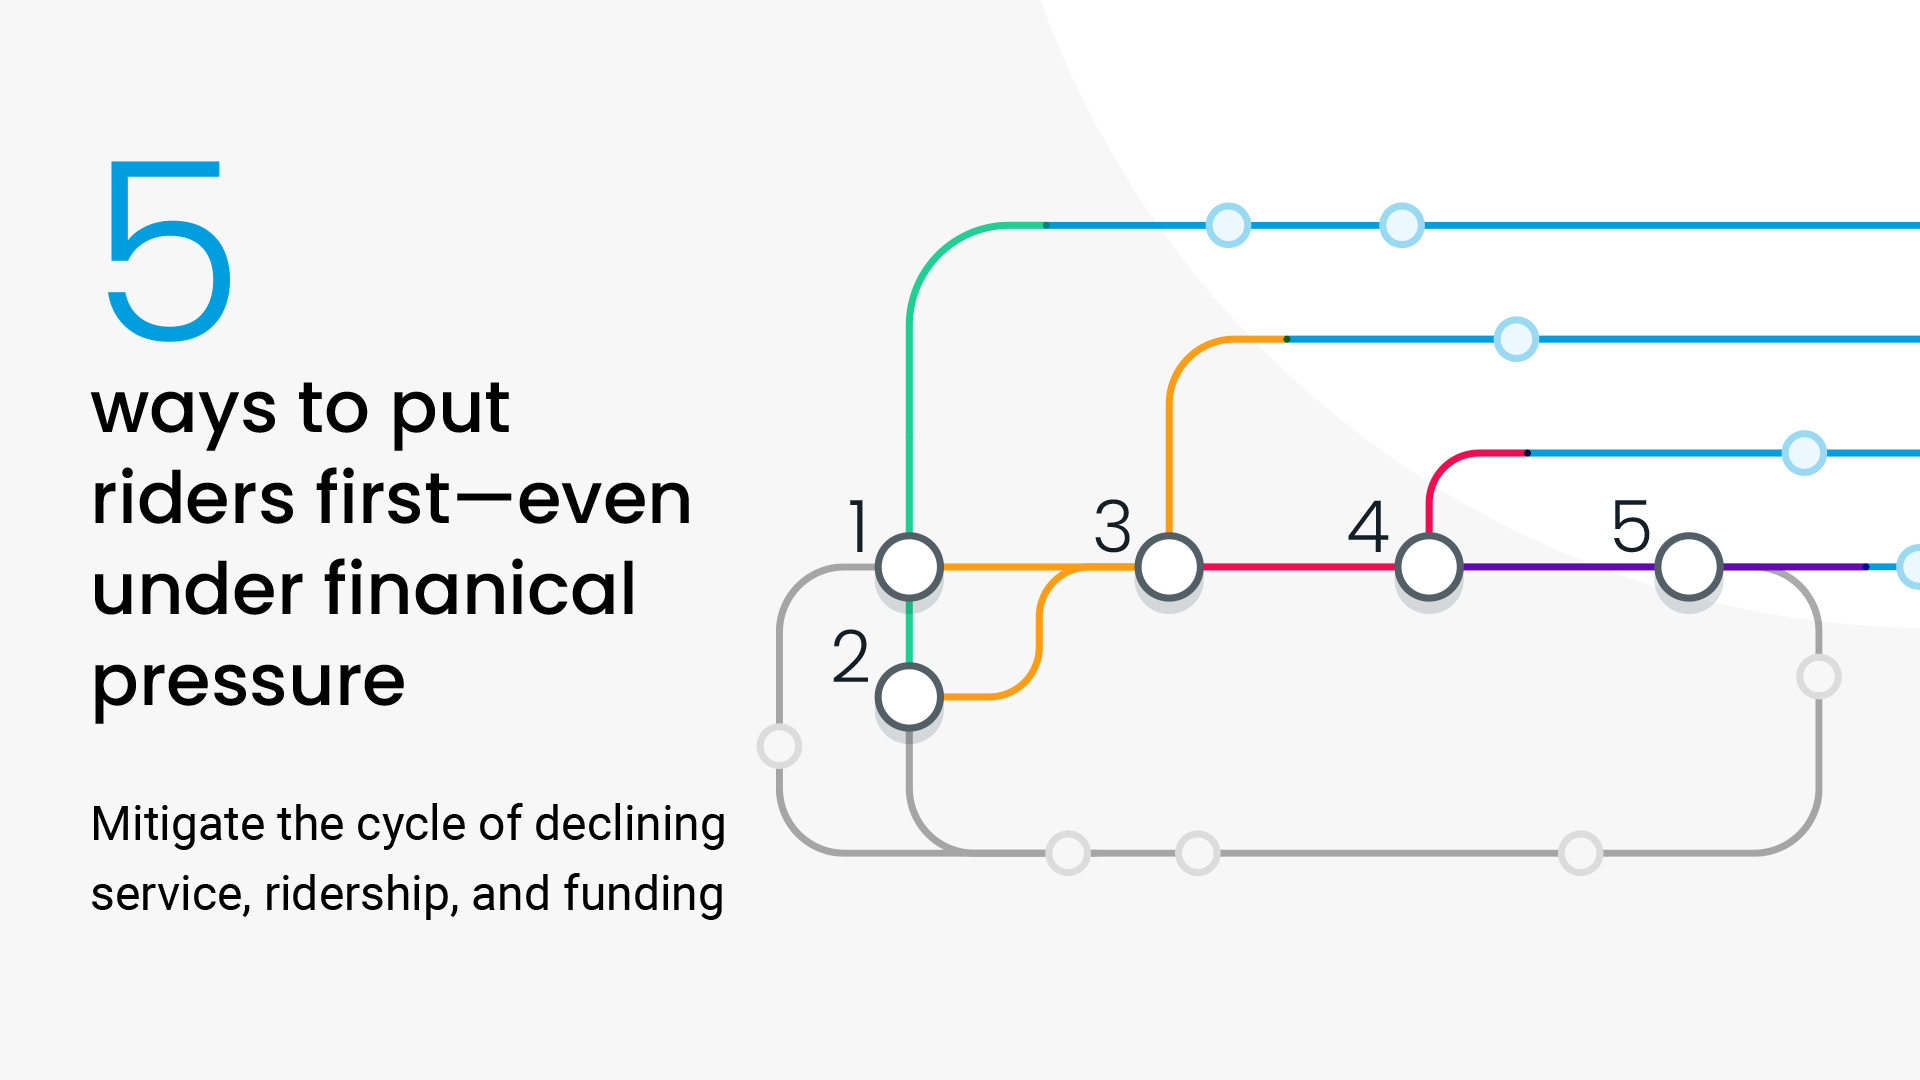
How agencies can improve ETA completeness
The good news is that the ETA Completeness Benchmark highlights a problem but also points toward solutions.
Some of the most effective strategies we’ve seen include:
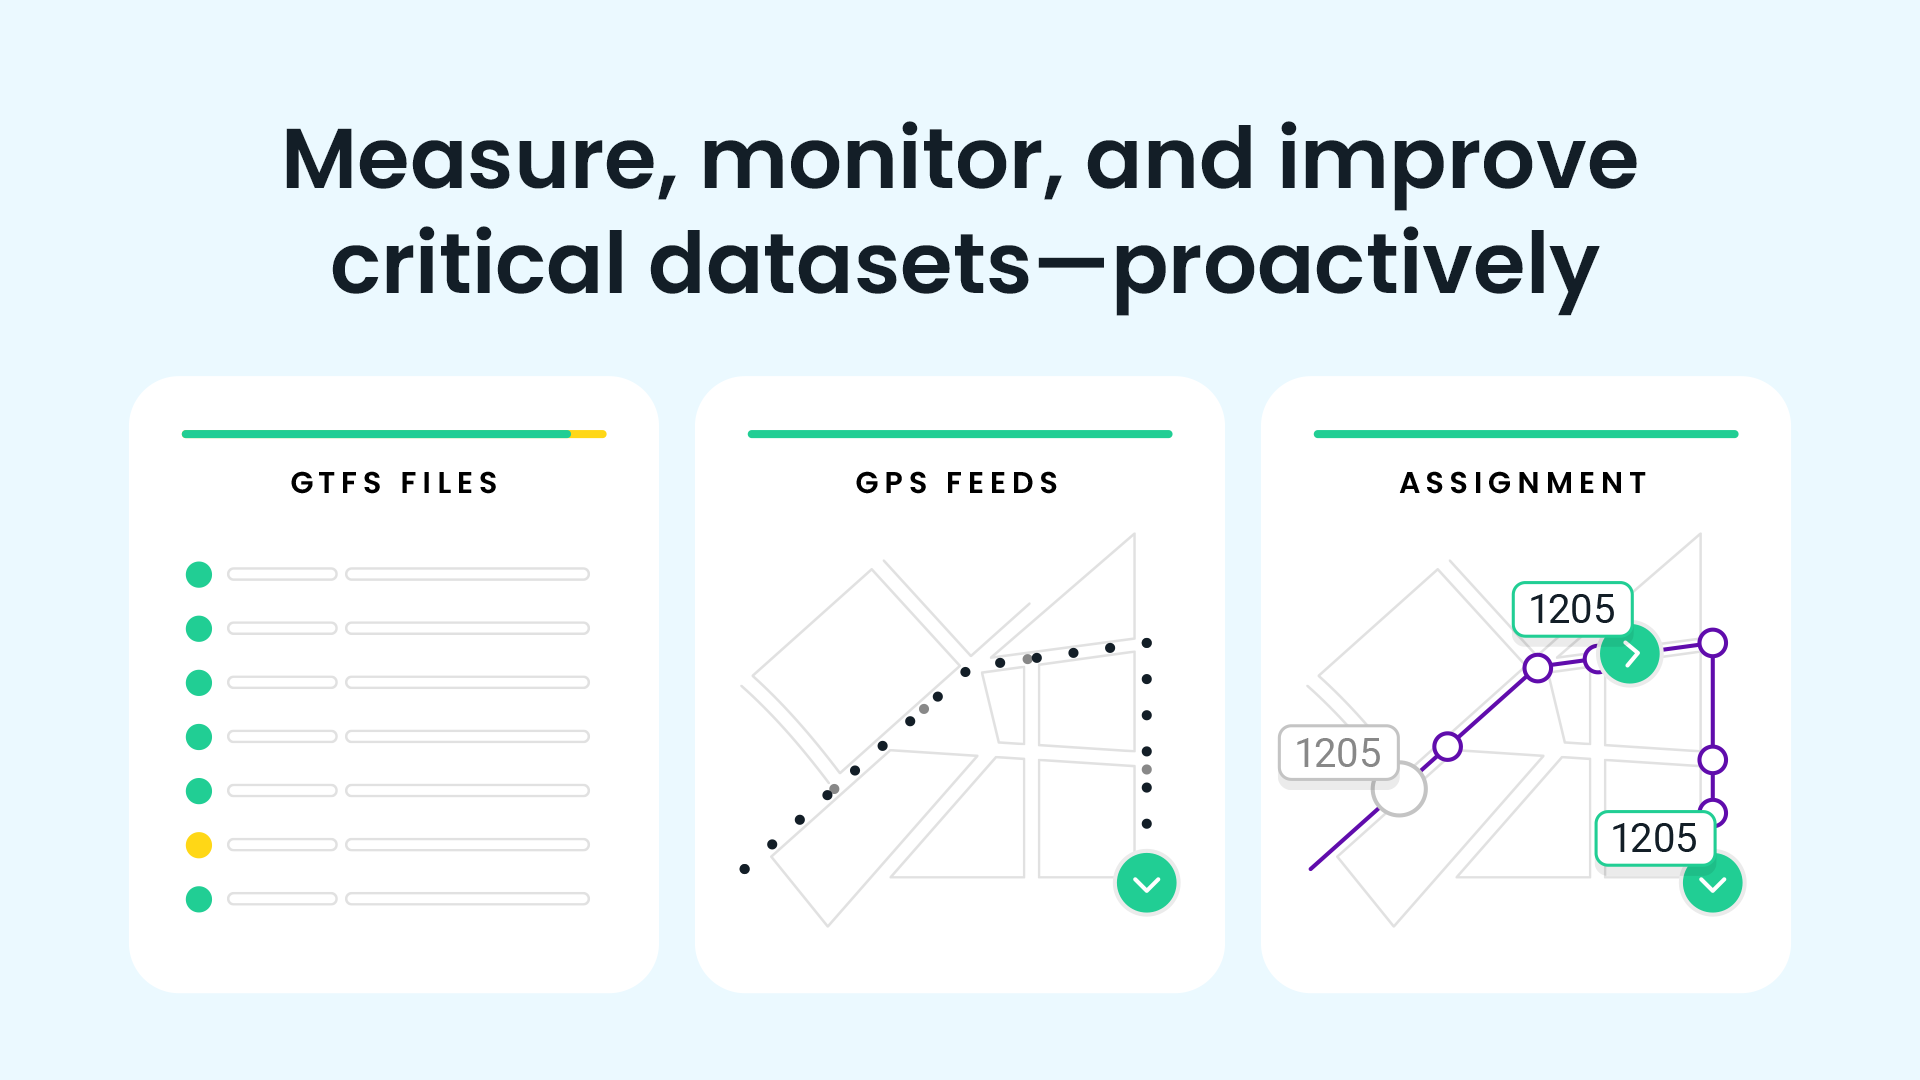
- Improving vehicle-to-block assignment. Automated assignment tools can significantly reduce trips that fall through the cracks due to operator log-in errors, last-minute vehicle swaps, and other common sources of unassigned service. When a vehicle is assigned to an otherwise-unassigned trip in operational software, ETAs are generated and riders see real information rather than a static scheduled time.
- Leveraging multiple AVL sources. Redundant feeds ensure that if one system goes down, the data isn’t lost entirely. Over any given 90-day period, Swiftly found one in four agencies experienced at least one GPS outage, illustrating the potential for substantial gains.
- Feeding service adjustments directly into real-time systems. When detours, closures, or cancellations happen, operational tools can automatically update rider-facing information to reflect temporary stops, cancellations, and detour paths.
These types of tactics can have a real, tangible impact on the rider experience. KCATA in Kansas City, for example, has implemented all of these strategies in recent years. Most notably, the agency overhauled its disruption management workflows so that trip cancellations and detours automatically update rider apps. Riders know when a stop is skipped and a bus won’t be coming.
Tyler Means, Chief Mobility and Strategy Officer, explains: “So what happens now is that dispatch can put a detour in and it automatically updates the rider. So a rider will know that the bus is no longer coming to them. We’re able to make sure that riders have the same information we do.”
Stories like this illustrate a key point: improving ETA completeness is central to making better decisions, using resources more efficiently, and delivering more reliable rider experiences.
What agencies and industry leaders are saying
Cal-ITP (California Integrated Travel Project)
“Our team at Cal-ITP is excited to have contributed to the development of the ETA Completeness industry benchmark for GTFS-Realtime data quality. Ensuring that riders and other data consumers can access reliable information is critical for decision making. Too often, agencies and their vendors have fallen short in delivering reliable and complete real-time information, which makes life much harder for the traveling public. We hope this benchmark helps agencies and vendors deliver ever-better and more complete GTFS-Realtime data.”
—Evan Siroky, Transit Data Quality Branch Manager
WeGo Public Transit (Nashville, TN)
“Riders depend on real-time information to make decisions, and agencies owe it to them to measure how consistently that information is getting through. The ETA Completeness Benchmark finally gives us a way to do that.”
—Dan Freudberg, Deputy COO
METRO (Akron, OH)
“With faster vehicle polling rates alongside Swiftly’s Auto-Assigner, our agency improved ETA completeness to 96.5%, which gives our riders confidence in real-time bus arrival information.”
—Jim Meduri, Senior Planner
DCTA (Denton County, TX)
“DCTA places a strong emphasis on delivering thorough and reliable information to our riders. This commitment is reflected in our day-to-day operations, our integration of multiple GPS data feeds with Swiftly, and our careful monitoring of service disruptions such as cancellations, closures, and detours. We're pleased to support this ETA Completeness Benchmark standard and welcome continued industry alignment around improving data completeness.”
—Kyler Hagler, Director of IT & Cybersecurity
Transit
“Real-time feeds that give riders on-again, off-again countdowns are a constant source of frustration. Too often, transit agencies have no idea how frequently they’re leaving riders in the dark. Swiftly and Cal-ITP are moving the industry in the right direction by developing the ETA Completeness Benchmark, and Transit’s app users will benefit on every trip they take.”
—Guillaume Campagna, Chief Technology Officer
Jarrett Walker + Associates
“We think this metric can help agencies measure the performance of their real-time feeds in a way that is directly responsive to the experience of a rider.”
—Evan Landman, Principal + Director of Research & Development
Left Turn Right Turn (LTRT)
“Ghost buses are one of the worst possible experiences for transit customers. Having a standardized way of measuring ETA completeness will allow us to evaluate how different solutions can address these data gaps, leading to improved public trust in transit.”
—Yuval Grinspun, Principal
Blinktag
“Most transit agencies have no clear way to measure how accurate their GTFS-Realtime data really is. The ETA Completeness Benchmark gives them a simple, standardized metric to understand how well their real-time predictions work for riders and how the data quality is changing over time.”
—Brendan Nee, Principal
Jarvus Innovations
“The ETA Completeness Benchmark is an intuitive metric that directly leverages the type of back-end data work we do to improve rider experience outcomes. It's exciting to have shared, reproducible definitions for metrics like this that can scale across the industry and that keep building on the work we were proud to help implement at Cal-ITP.”
—Chris Alfano, CEO
Actionfigure
“Real-time information sets expectations for travelers, and incomplete data breaks them. Whenever someone checks one of thousands of Actionfigure’s TransitScreen displays, sees a bus coming, and it never shows up, we all lose a little trust. Transit operators need trust to maintain healthy customer relationships. Completeness has been the missing real-time data measurement for years, and we’re excited the industry now has a shared standard for it.”
—Matt Caywood, CEO
What’s next for data quality?
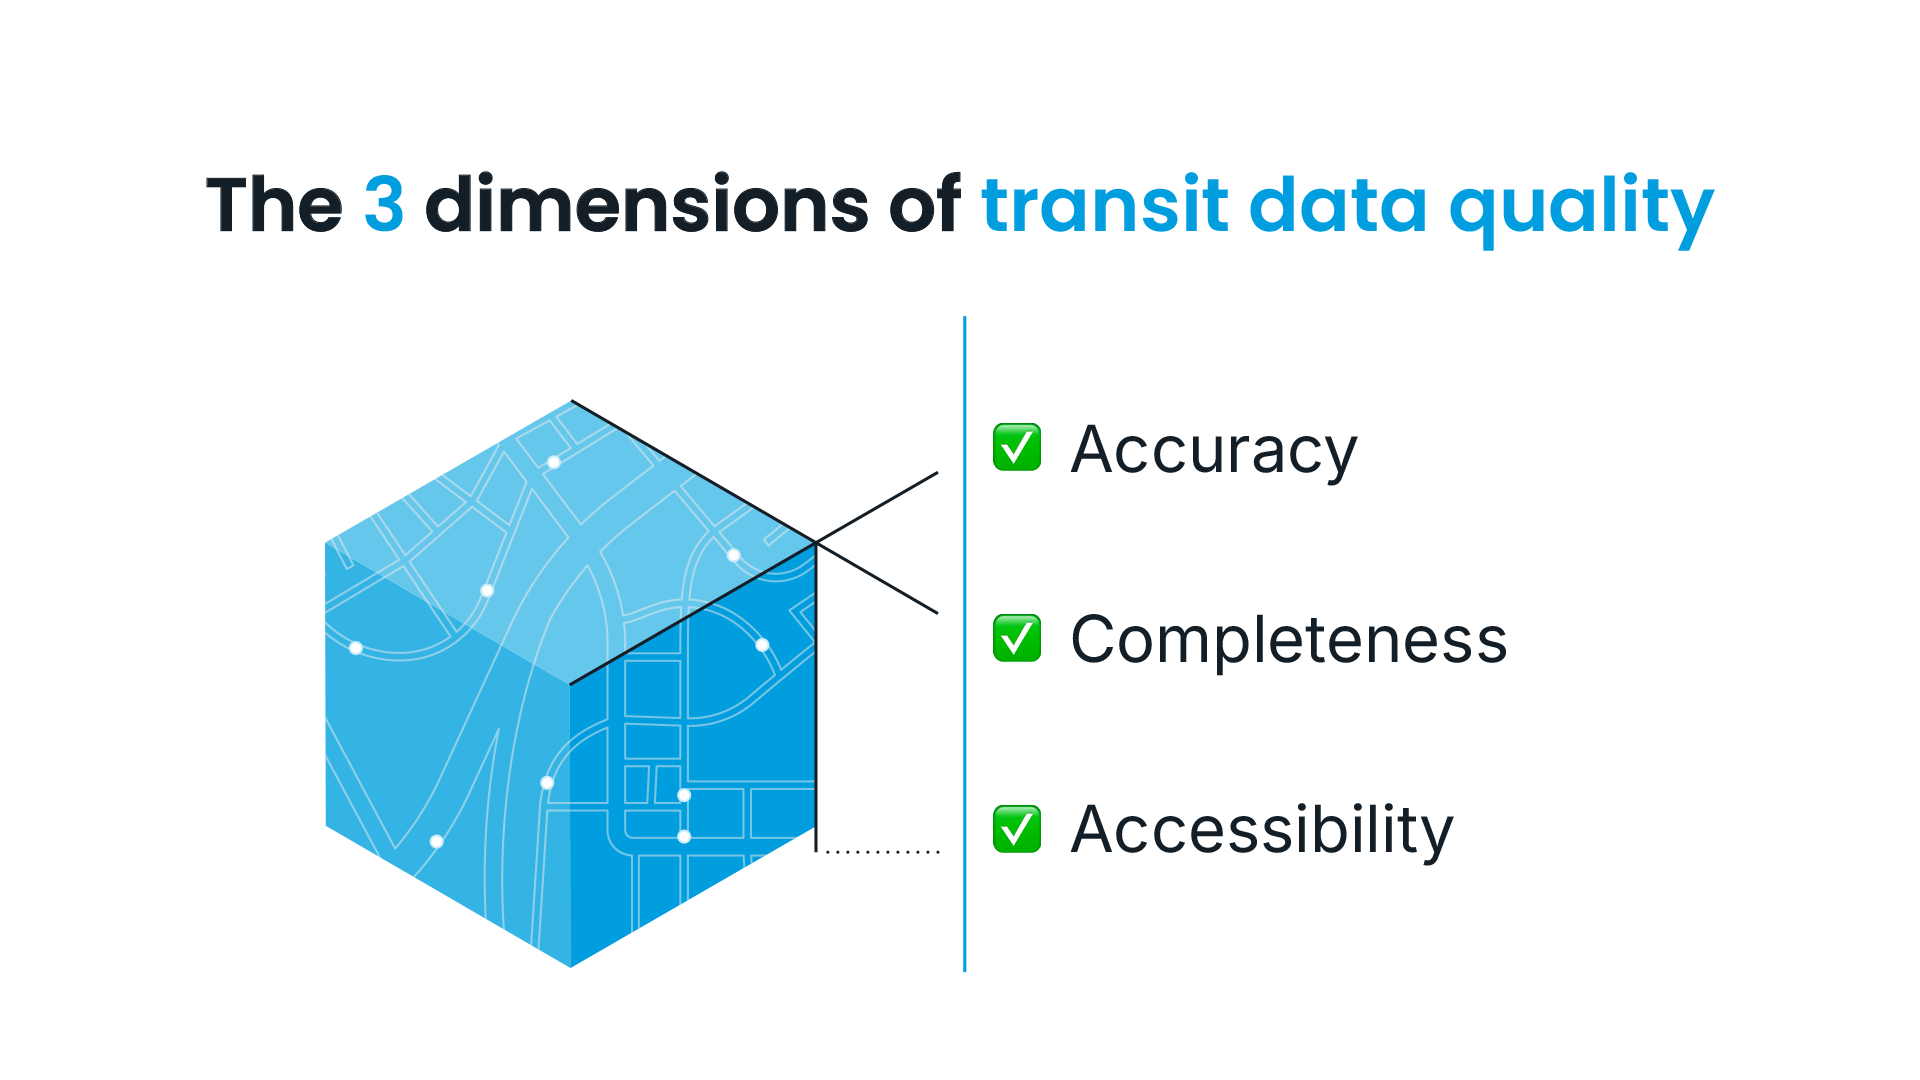
ETA completeness is only one dimension of a three-part framework for evaluating real-time transit data quality. Accuracy measures whether predictions are correct. Completeness measures whether predictions exist at all. Accessibility, the third dimension, measures whether real-time information reaches riders consistently across all passenger-facing channels, from agency-owned apps to third-party platforms like Google Maps and Transit.
Each dimension offers valuable insight on its own, but together they give agencies a complete picture of how riders actually experience real-time information. With shared benchmarks across all three, agencies can assess progress, set goals, and collaborate on raising the bar for reliability industry-wide.
When riders know they can trust the system, and when agencies have the data to back that trust up, everyone wins.
Ready to see where your agency stands?
Get a personalized look at your agency’s ETA completeness and learn what it would take to close the gaps.
Appendix: Benchmark definition
The precise definition used in calculations is: The percentage of scheduled trip-stop combinations over a given time period that either (1) had an assigned vehicle and at least one prediction between 0-15 minutes out, or (2) had a “CANCELLED” designation for the trip ID or “SKIPPED” designation for the stop ID.
(Note that what is not included in this analysis, but is also important, is the provision of service alerts and trip modifications data. Both are extremely valuable data sources for many passenger-facing tools and go beyond ETAs to provide other contextual information on service changes and detours. However, for simplicity, this benchmark is focused specifically on the completeness of ETA data in the trip updates feed.)
Check out the technical documentation for the ETA Completeness Benchmark.
The rich text element allows you to create and format headings, paragraphs, blockquotes, images, and video all in one place instead of having to add and format them individually. Just double-click and easily create content.
Last Name, Agency

What’s a Rich Text element?
What’s a Rich Text element?
What’s a Rich Text element?
What’s a Rich Text element?
What’s a Rich Text element?
The rich text element allows you to create and format headings, paragraphs, blockquotes, images, and video all in one place instead of having to add and format them individually. Just double-click and easily create content.
Last Name, Agency
Static and dynamic content editing
A rich text element can be used with static or dynamic content. For static content, just drop it into any page and begin editing. For dynamic content, add a rich text field to any collection and then connect a rich text element to that field in the settings panel. Voila!
How to customize formatting for each rich text
Headings, paragraphs, blockquotes, figures, images, and figure captions can all be styled after a class is added to the rich text element using the "When inside of" nested selector system.
- text goes here
- text goes here
- text goes here
- text goes here
- text goes here
- text goes here


Swiftly, Inc.
2261 Market Street #4151
San Francisco, CA 94114
©2026 Swiftly, Inc. All rights reserved.


It looks like you're located in Spain.
¿Quieres visitar nuestro sitio web en español?
