May 5, 2026
4 ways ridership data is reshaping transit decisions across every team

Aarathi Ramnath
Strategic Product Marketing Manager
May 5, 2026
4 ways ridership data is reshaping transit decisions across every team
Aarathi Ramnath
May 5, 2026
4 ways ridership data is reshaping transit decisions across every team
Aarathi Ramnath
Strategic Product Marketing Manager
Riders don't experience your data. They experience your decisions.
But for most teams, ridership and service performance data live in separate systems, so the full picture is rarely available when a decision gets made.
This isn't just a planning problem. It's a challenge for leadership, Operations, IT, and Procurement. At a time when agencies of every size are being asked to cut services or do more with the same resources, working from partial views isn't just inefficient—it's costly.
That's about to change.
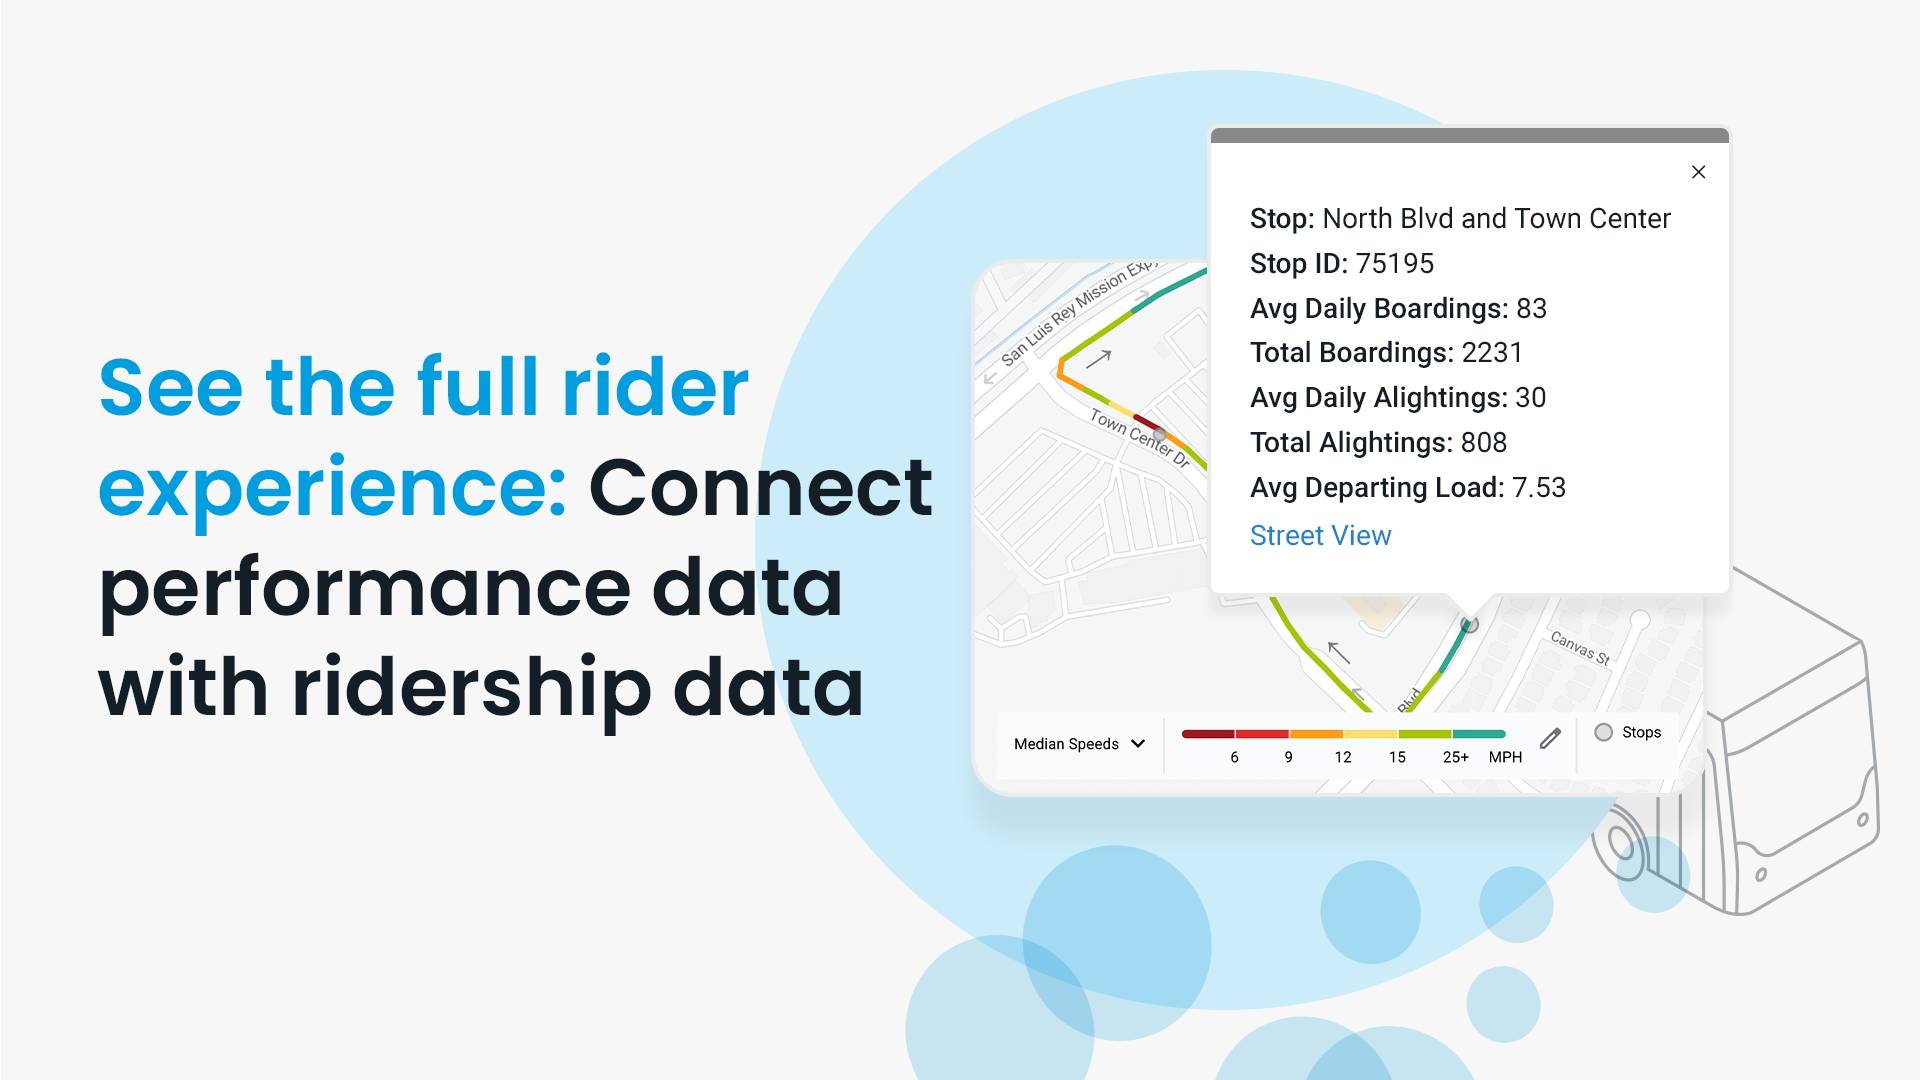
Swiftly is bringing ridership data directly into the Speed Map, Run-Times, and On-Time Performance products—so you can see not just where service is underperforming, but how many riders are affected and why.
Talk to an expert about your agency.
“We ended up making a route change based on Swiftly Ridership (formerly Hopthru Ridership) data, and we saw a 47% increase in ridership on that line.”
—Ricky Cervantes, Senior Planner at North County Transit District (NCTD)
1. Planners are prioritizing by rider impact, not just operational visibility
Planning workflows start with investigating performance: routes with poor on-time performance (OTP), the slowest speeds, the longest run-times. But translating performance trends into which specific trips or segments affect the most riders—precisely enough to act quickly or defend in a meeting—still means pulling from separate systems, often with outdated data.
Stop-level ridership data changes what's possible. At North County Transit District (NCTD), the team used ridership data to validate where demand was strongest, realigned a route to match it, and saw a 47% increase in ridership on that line. The decision was grounded in data that wouldn't have been visible from performance metrics alone.
The same logic applies day-to-day. A trip running five minutes late on a low-ridership route is a different problem than the same delay on a corridor with thousands of daily boardings—but quantifying that precisely enough to act, or defend decisions in front of stakeholders, still requires manual cross-referencing without ridership in the same view.
Now available: Stop consolidation with Speed Map
Before: A planner works across multiple tools to combine speed and ridership data, then spends hours building a case for the next planning review.
After: A planner opens Speed Map, sees ridership volume overlaid on slow segments, and spots which stops contribute to delays while serving few riders. The planner builds the case for stop consolidation in minutes.
Schedulers can do the same with Run-Times—surfacing trips that combine high loads with unexpected delays and focusing adjustments on the runs where poor performance impacts the most riders.
Now available: Diagnosing dwell with Run-Times
Run-Times can distinguish between dwell time driven by heavy boarding and alighting activity versus dwell time that occurs with little or no passenger movement—indicating an operator may be holding at a timepoint rather than waiting due to rider demand.

Before: Long dwell time is visible, but there's no way to know if the cause is a crowded stop or a vehicle operator holding for time. The scheduler pads the schedule “just in case”—adding cost without fixing the root cause.
After: Checking ridership data alongside dwell time tells schedulers whether the fix is a schedule change or an operational one.
For planners and schedulers: Knowing which performance issues affect the most riders changes what gets fixed first—and builds the evidence base for every recommendation you take into a planning meeting.
2. Executives have the defensible narrative they need
When boards ask about OTP, the real question is how reliability is impacting riders.
An executive who can say “we prioritized this corridor because it carries the majority of daily boardings and serves a Title VI-relevant concentration of transit-dependent riders” is having a fundamentally different conversation than one presenting a list of delayed routes.
Now available: Quantifying the impact of reliability with On-Time Performance
Before: The on-time performance dashboard shows which trips are late, but knowing a route is busy isn't the same as being able to quantify—quickly and precisely—how many riders a specific delay affected. Without ridership in the same view, that question still requires manual cross-referencing before it can be answered in a board meeting.
After: With ridership in the same view, an executive can check passenger volume for any delayed trip and walk into a board meeting ready to say not just which routes are underperforming, but how many riders are affected.
As agencies face growing expectations around performance and Title VI, connecting decisions to rider impact makes them easier to defend.
For executives: This comes down to credibility—having a clear, well-connected story that holds up in board meetings and budget conversations.
3. Operations teams can respond faster and more precisely
Prioritizing the right issues is one thing; diagnosing them correctly is another.
Consider a dwell-time issue at a stop serving significantly more riders per hour than another—without ridership context, the two look identical in the data. Ridership in On-Time Performance helps the operations team diagnose why a trip is late.

Ridership context makes that distinction visible without manual cross-referencing. When context is shared across teams, agencies spend less time circling the same issues and more time acting with confidence.
For operations teams: Understanding which delays matter most enables you to take more efficient action.
4. IT and procurement teams have the data foundation they need
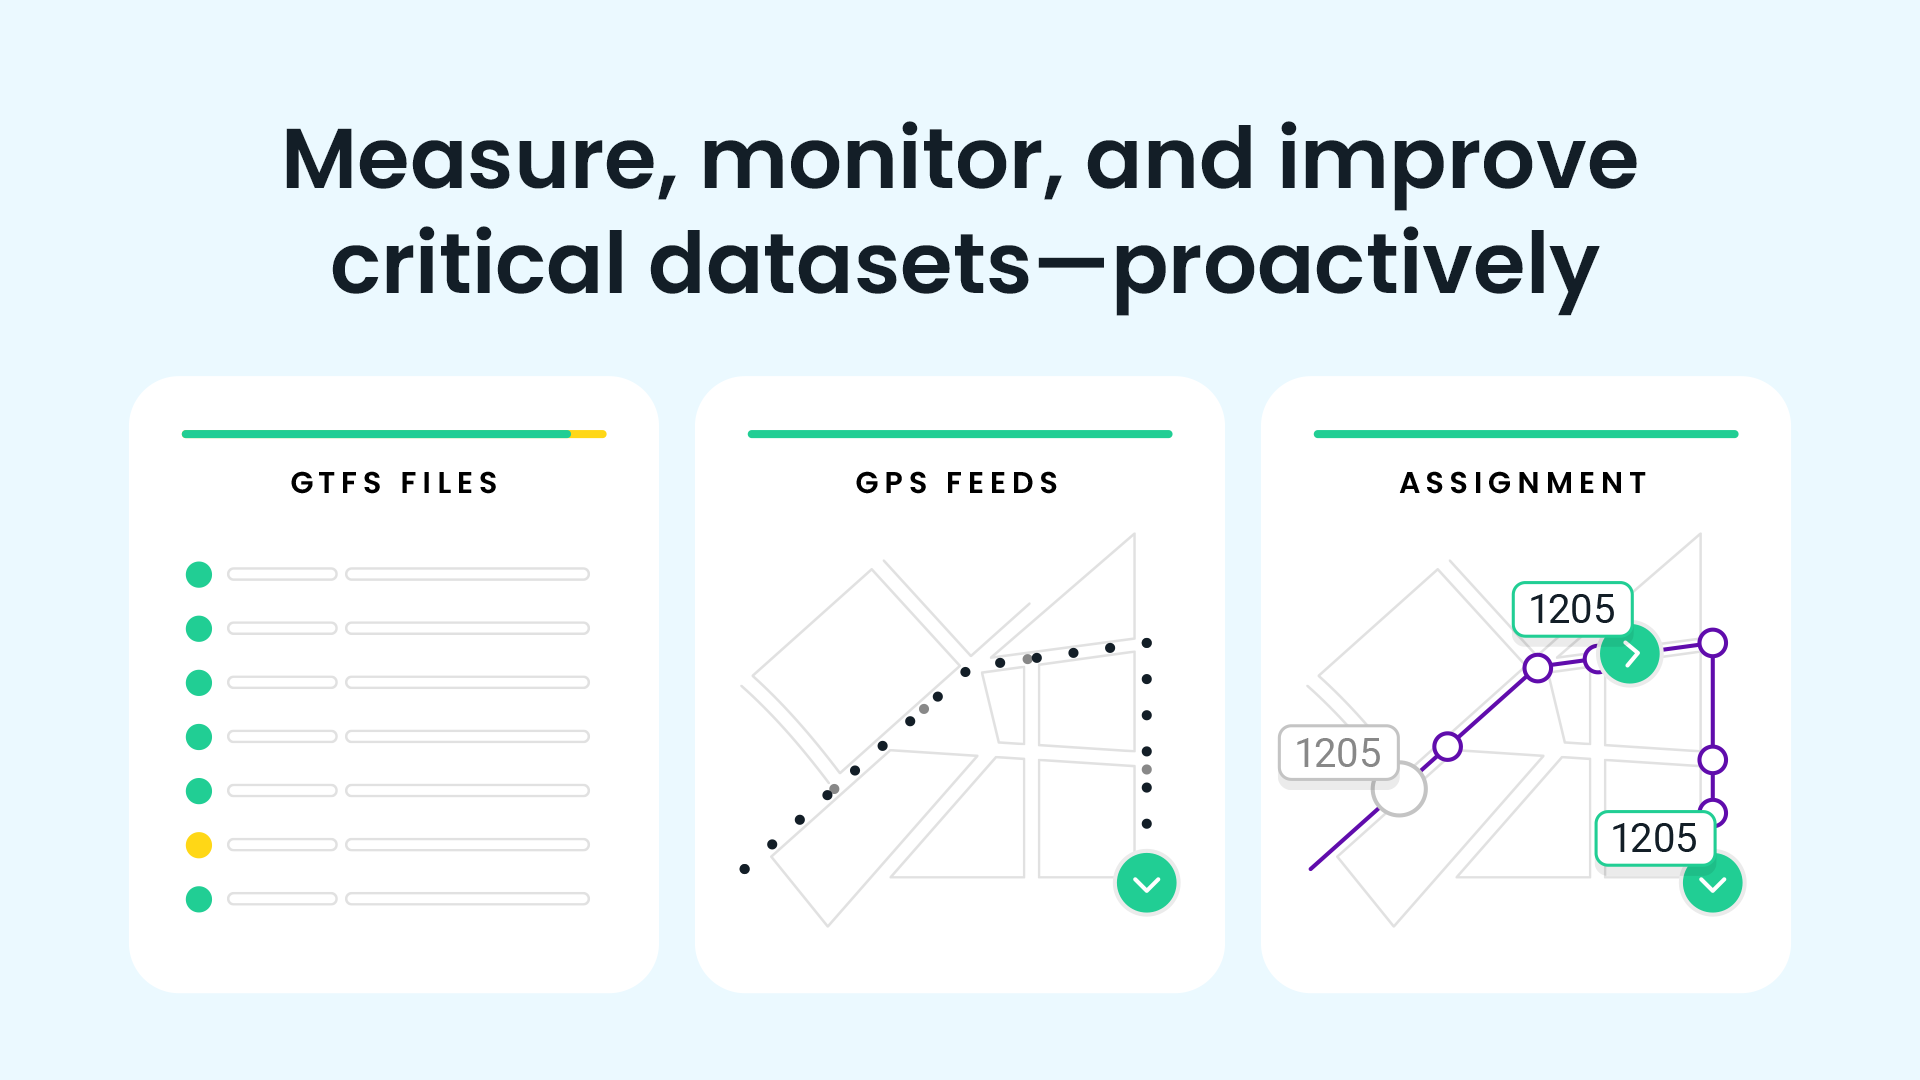
Everything above depends on whether the data foundation can be trusted, shared, and sustained. Security, interoperability, and flexibility aren't afterthoughts—they determine whether planners can rely on the data, executives can defend it, and operations can act on it.
Two key requirements are worth calling out:
🔗 API access keeps ridership data from getting locked in a single tool. It flows into planning, operations, and reporting environments so every team works from the same source of truth—and gives agencies ownership of their data, not just access.
🔒 SOC 2 Type II certification ensures ridership data is handled with the rigor required to withstand audit, board review, and public reporting. When data is stitched together across systems, that standard is hard to maintain—which is why a unified, certified platform matters.
Together, these aren't features. They're what let ridership context scale across teams, turning a point solution into a foundation the whole organization can rely on.
For IT and procurement: Platforms that are interoperable (API-ready) and secure (SOC 2 Type II) can grow with your agency's needs—not lock you in.
The future of transit decisions is measuring passenger impact
That's the shift underway—from ridership as a reporting function to ridership as a foundation for action.
Better data is a prerequisite. Better decisions are the outcome.
When every team—planners, executives, operations, IT, and procurement—works from the same ridership context, decisions move faster and the agency speaks with one voice in planning meetings, operations calls, and boardrooms.
That’s the difference between reporting outcomes and defending decisions.
Request a demo to see how agencies are connecting ridership and performance data to make decisions with confidence.
Request a demo
See how agencies are connecting ridership and performance data to make decisions with confidence
The rich text element allows you to create and format headings, paragraphs, blockquotes, images, and video all in one place instead of having to add and format them individually. Just double-click and easily create content.
Last Name, Agency

What’s a Rich Text element?
What’s a Rich Text element?
What’s a Rich Text element?
What’s a Rich Text element?
What’s a Rich Text element?
The rich text element allows you to create and format headings, paragraphs, blockquotes, images, and video all in one place instead of having to add and format them individually. Just double-click and easily create content.
Last Name, Agency
Static and dynamic content editing
A rich text element can be used with static or dynamic content. For static content, just drop it into any page and begin editing. For dynamic content, add a rich text field to any collection and then connect a rich text element to that field in the settings panel. Voila!
How to customize formatting for each rich text
Headings, paragraphs, blockquotes, figures, images, and figure captions can all be styled after a class is added to the rich text element using the "When inside of" nested selector system.
- text goes here
- text goes here
- text goes here
- text goes here
- text goes here
- text goes here


Swiftly, Inc.
2261 Market Street #4151
San Francisco, CA 94114
©2026 Swiftly, Inc. All rights reserved.


It looks like you're located in Spain.
¿Quieres visitar nuestro sitio web en español?
