October 26, 2018
Baltimore Develops a Golden Method for Transit Signal Priority

Swiftly
October 26, 2018
Baltimore Develops a Golden Method for Transit Signal Priority
Swiftly
October 26, 2018
Baltimore Develops a Golden Method for Transit Signal Priority
Swiftly
When the MDOT MTA team in Baltimore, MD, received a small pot of funds for a second round of transit signal priority (TSP) projects last year, they wanted to select a corridor that would save the greatest amount of time for the greatest number of riders. With Swiftly, the team was able to use their ideal methodology, to surprising results.
By the numbers
- By implementing TSP, run times along selected corridors have dropped by 20 percent during peak hours
- Run times will drop by an average of 5 to 8 percent on these corridors throughout the day
Expanding TSP to new corridors
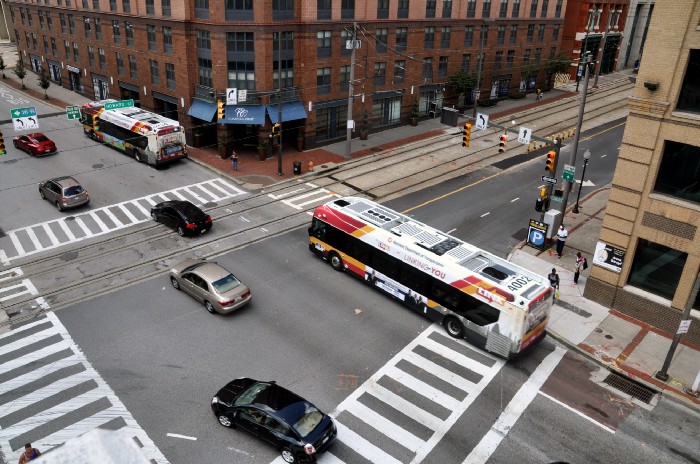
Last year, MDOT MTA launched BaltimoreLink, a complete re-imagining of the city’s transit network. Together with new routes, new vehicles, and new schedules, the overhaul included dedicated bus lanes and transit signal priority (TSP) along select corridors to help keep transit travel times predictable down some of the city’s most congested streets.
And for the corridors selected to receive TSP, the projects have contributed significantly to on-time performance. “Needless to say, we love TSP projects,” says Krae Stieffenhofer, Transportation Planner at MTA. “They’re impactful because they almost always improve service reliability.”
So when the planning team decided to move forward with a second round of TSP projects earlier this year, they looked to expand TSP projects along a few more corridors.
“Our consultants looked closely at ridership, but they didn’t focus on time as much as we might’ve wanted.”
A traditional methodology missing a parameter
At first, the MDOT MTA team discussed the expansion plan with the consultants behind previous rounds of TSP planning. But in the back of their minds, the team had a hunch that the methodology could be improved.
“We always try to prioritize corridors where we see the most time benefits for passengers,” says Cole Greene, Manager of Data Analytics at MDOT MTA. “Our consultants looked closely at ridership, but they didn’t focus on time as much as we might’ve wanted.”
In the original TSP plan, the consulting firm recommended pilot corridors based on congestion and ridership levels along the associated routes — a traditional and well-tested methodology. However, the team wasn’t able to quantify the amount of time vehicles were stuck in traffic. Adding this dataset would help refine the analysis and improve the selection process.
So Stieffenhofer and Greene sat down and drafted their ideal methodology and took stock of the tools at their disposal. “With Swiftly, we had the data to go with our methodology,” says Greene. “Owning our own data was what we needed.”
“With Swiftly, we had the data to go with our methodology. Owning our own data was what we needed.”
Adding time savings to the equation
Armed with the necessary data, the team got to work. Finding the perfect corridor for their TSP funds was an elaborate, data-driven process of elimination. Of their twelve CityLink routes, two already had TSP from the BaltimoreLink launch; one was slated for TSP from a TIGER grant; and five corridors went outside the city limits, disqualifying them from city funds. That left four corridors, all with varying levels of congestion and ridership, to choose from.
Combining wait times with ridership load factors, Greene and Stieffenhofer weighed the relative impact that TSP would have on passengers on each corridor, then scored them based on both congestion and ridership.
“We used a ‘dot-density’ technique based on Swiftly data around traffic signals to figure out how long buses were stopped at that particular traffic signal,” Greene says. “And then we used that to calculate an average wait time per trip by joining it with the number of trips that went through that intersection in that day.”
With this methodology, the MTA team found the corridors that would benefit most. “If there are two buses that are packed with people, and one is waiting for a really long time at an intersection, and the other one is waiting for only a little while at an intersection, the bus that’s waiting longer, with more people, deserves the TSP,” Greene explains. “Swiftly was the big linchpin to the entire analysis.”
“Swiftly was the big linchpin to the entire analysis.”
A surprise outcome
In the end, two corridors won out. The addition of TSP along those stretches of road is projected to speed up trips up to 20 percent per trip during peak hours, and an average of 5 to 8 percent per trip across the entire day.
But most surprisingly, the winning corridors were not what the team expected. “We thought Edmondson Avenue would benefit from the TSP most. But as it turns out, our buses don’t actually get caught at those lights a lot,” Stieffenhofer says. “And on CityLink Blue too, there’s a peak hour restriction on parking, and even when the parking restriction is lifted, not many passenger vehicles travel in the lane, since there is a lot of bus traffic.”
“These things aren’t easy to capture in other models, but our new methodology definitely captured all of it,” Stieffenhofer says.
Having access to the data in Swiftly allowed the team to avoid confirmation bias and find opportunities to help more people save more time.
“Swiftly is just such an easily accessible, comprehensive tool to understand how our transit system is operating. And the fact that it’s intuitive and visual? That doesn’t hurt.”
Quantifying the unknown
With Swiftly, the MDOT MTA team now has a way to quantify the issues with their network, as well as clearly show the impact of problems they may not fully understand yet.
“Swiftly is just such an easily accessible, comprehensive tool to understand how our transit system is operating,” says Stieffenhofer. “And the fact that it’s intuitive and visual? That doesn’t hurt.”
Request a demo
The rich text element allows you to create and format headings, paragraphs, blockquotes, images, and video all in one place instead of having to add and format them individually. Just double-click and easily create content.
Last Name, Agency

What’s a Rich Text element?
What’s a Rich Text element?
What’s a Rich Text element?
What’s a Rich Text element?
What’s a Rich Text element?
The rich text element allows you to create and format headings, paragraphs, blockquotes, images, and video all in one place instead of having to add and format them individually. Just double-click and easily create content.
Last Name, Agency
Static and dynamic content editing
A rich text element can be used with static or dynamic content. For static content, just drop it into any page and begin editing. For dynamic content, add a rich text field to any collection and then connect a rich text element to that field in the settings panel. Voila!
How to customize formatting for each rich text
Headings, paragraphs, blockquotes, figures, images, and figure captions can all be styled after a class is added to the rich text element using the "When inside of" nested selector system.
- text goes here
- text goes here
- text goes here
- text goes here
- text goes here
- text goes here


Swiftly, Inc.
2261 Market Street #4151
San Francisco, CA 94114
©2026 Swiftly, Inc. All rights reserved.


It looks like you're located in Spain.
¿Quieres visitar nuestro sitio web en español?
