March 29, 2019
How Well Is America Sticking to its Promised Headways?

Swiftly

March 29, 2019
How Well Is America Sticking to its Promised Headways?
Swiftly
March 29, 2019
How Well Is America Sticking to its Promised Headways?
Swiftly
There’s a first time for everything, even headway analysis
For most agencies, on-time performance is the gold standard for measuring transit reliability. But based on conversations we’ve had with agencies, we’ve noticed a serious limitation of on-time performance analysis: it doesn’t do a great job of measuring reliability on high-frequency routes.
Understanding the consistency of headways on high-frequency routes is quickly becoming a best practice in the field — New York City MTA, Transport for London, and MBTA have all formally adopted “excess wait time” metrics into their reporting — but for most other agencies, analyzing service reliability of high-frequency routes is kind of a guessing game.
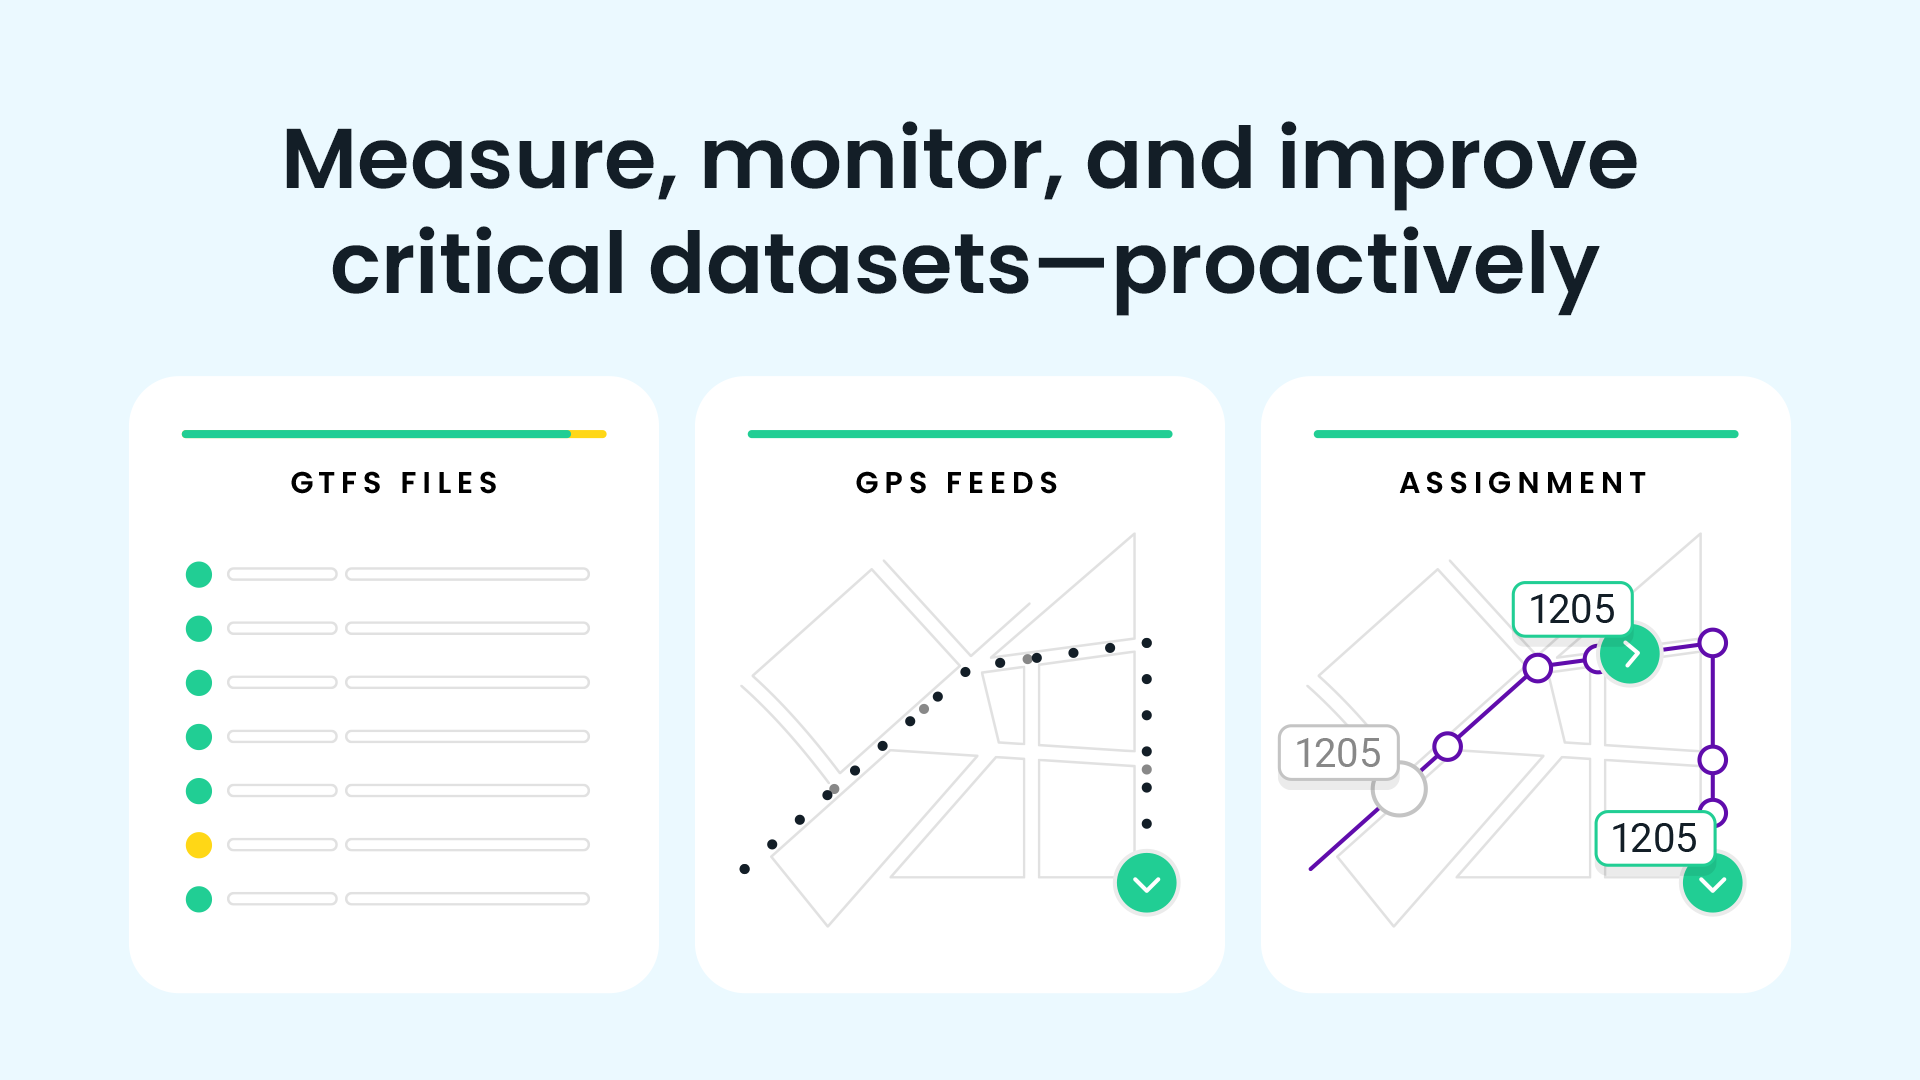
To provide some color on the topic, we did what we do best and took a look at the data. We analyzed millions of data points to understand headway adherence trends and get a better picture of how well America’s cities are keeping to their scheduled headways.
And what we found is surprising. Headways are not holding up the way they should be, and it’s seriously affecting transit reliability, along with riders’ perceptions of it.
The case for headway adherence analysis
To understand the importance of headway analysis, it’s important to first understand what on-time performance analysis is and where it stops being useful.
Transit reliability is more than just sticking to your schedule. It’s about delivering what riders expect.
By definition, on-time performance — i.e. being “early,” “late,” or “on time” — measures how well vehicles stick to scheduled arrival and departure times. And since reliability is all about being on time, sticking to your schedule should be the be-all-end-all, right?
Well, sort of. Transit reliability is more than just sticking to your schedule. It’s about delivering what riders expect.
On-time performance analysis is great for measuring reliability on lower-frequency routes, when riders are likely to consult the route’s schedule. (Shameless plug: Swiftly has a powerful module for analyzing this, called Swiftly On-Time Performance. Check it out.)
On high-frequency routes, however, vehicle schedules are much, much less important for “show-up-and-go” riders, if not completely irrelevant. When a rider knows a bus will come every ten minutes, “on-time” to them simply means they’ll wait an average of five minutes and never longer than ten minutes. The schedule doesn’t even come into play.
To illustrate, let’s look at an example. Imagine a route with a ten-minute headway with vehicles arriving at a given stop at 12:00, 12:10, 12:20, and so on. If the bus arrives at 12:00, 12:10, 12:20, and so on, then we say the route has 100% on-time performance.
Now let’s say vehicles consistently arrive seven minutes late according to the schedule — at 12:07, 12:17, 12:27, and so on. In this scenario, on-time performance drops to 0% since no vehicles arrive according to the schedule. But really, show-up-and-go riders are still waiting an average of five minutes, and never longer than ten. As far as they’re concerned, the route is still 100% reliable.
On high-frequency routes, vehicle schedules are much less important for “show-up-and-go” riders, if not completely irrelevant.
So if show-up-and-go riders don’t care about schedules on high-frequency routes, should you be spending energy analyzing on-time performance for those routes?
The answer is a resounding no. For high-frequency service, you shouldn’t care about schedule adherence; you should care solely about headway adherence.
What exactly is headway adherence?
In principle, headway adherence is the same thing as on-time performance but with one main difference; the frame of reference for “on time” is a moving target (other buses) rather than a fixed one (the schedule).
To be precise, headway adherence compares actual headways to scheduled headways. Actual headway measures the departure time of a vehicle compared to the departure time of the preceding vehicle serving the same stop on the same route. Scheduled headway compares the scheduled departure time of a vehicle against the scheduled departure time of the preceding vehicle serving the same stop on the same route.
Headway analysis is a way to ground performance metrics in what actually affects the rider experience, rather than relying on the reporting convention of schedule adherence.
Instead of “early,” “late,” and “on time” buses, we get “bunched,” “gapped,” and “expected” buses. In our analysis, a departure is considered bunched if headway less than two minutes and considered gapped if headway is greater than scheduled headway plus five minutes. (These are the rules SFMTA uses).
In short, headway adherence is a high-frequency version of on-time performance. It’s a way of grounding performance metrics in what actually affects the rider experience, rather than relying on the reporting convention of schedule adherence.
Headway adherence benchmarking
So why does this matter? The overall median for headway adherence is not very encouraging. Our data shows that reliability of high-frequency transit, on the whole, ranks around 75% — a “C” in academic terms — slightly better than what TransitCenter found in their recent report on on-time performance.
We compiled a dataset of historical GPS information from the country’s twelve largest cities, looked at millions of vehicle departures, filtered on high-frequency routes (15-minute headways and under), and graphed it out. Here’s what we found:

The first thing you’ll notice is that we anonymized the names of the cities. There’s a lot that goes into these metrics, and we don’t want to ‘out’ any single agency for having a high or low number that’s best understood in its full context. (We’d be more than happy to walk you through your agency’s metrics with full context. Just reach out.)
In our non-anonymized ranking, we noticed that higher-density cities tend to have higher bunching and gapping percentages. This makes sense because denser cities tend to have more congestion, which is the single biggest drag on transit reliability.
We also found that agencies with low bunching and gapping tend to build a lot of slack into their schedules. On the one hand, this is a good thing because slack gives operators room to make up for slower segments and stick to their headways. On the other hand, excessive slack can encourage bus dragging, long dwell times at stops, and overall inefficiency. These practices can cause riders to abandon transit, so again, low bunching and gapping numbers shouldn’t be taken in isolation. As they say, scheduling is an art as well as a science.

Another thing to note is the correlation between high bunching and high gapping. It’s not surprising that a correlation exists, since one stop’s bunched bus is another stop’s gapped bus. But it’s worth observing that the relationship between bunching and gapping is far from one-to-one.
For example, Cities 1 and 3 are ranked first and third by gapping percentage, but ranked fifth and sixth by bunching percentage. This reflects that these cities are employing real-time solutions like short turns or stop leapfrogging to counteract bunching once buses start to fall behind. And as we can see, these tactics go a long way in maintaining headways.
But the biggest takeaway of all is the state of transit reliability in general. Even the best agencies have 15% of buses gapped or bunched on a given day, and the worst offenders are over one-third bunched or gapped. Not great.

Measuring reliability the right way
All of this adds up to one thing: reliability is essential for transit’s wellbeing. If transit isn’t reliable, people will stop using transit. Studies show that consistent travel times, including reliable headways, are one of the most important predictors of customer satisfaction. Thankfully most agencies are using on-time performance metrics to measure and combat unreliability. But for high-frequency service, headway adherence is the only metric that matters.
You can’t fix a problem you don’t understand. If we keep using on-time performance analysis where headways analysis would work better, we’ll continue to get a skewed picture of what’s happening on our streets.
Transit reliability is important. It’s time that our metrics accurately reflect the rider experience.
Request a demo
The rich text element allows you to create and format headings, paragraphs, blockquotes, images, and video all in one place instead of having to add and format them individually. Just double-click and easily create content.
Last Name, Agency

What’s a Rich Text element?
What’s a Rich Text element?
What’s a Rich Text element?
What’s a Rich Text element?
What’s a Rich Text element?
The rich text element allows you to create and format headings, paragraphs, blockquotes, images, and video all in one place instead of having to add and format them individually. Just double-click and easily create content.
Last Name, Agency
Static and dynamic content editing
A rich text element can be used with static or dynamic content. For static content, just drop it into any page and begin editing. For dynamic content, add a rich text field to any collection and then connect a rich text element to that field in the settings panel. Voila!
How to customize formatting for each rich text
Headings, paragraphs, blockquotes, figures, images, and figure captions can all be styled after a class is added to the rich text element using the "When inside of" nested selector system.
- text goes here
- text goes here
- text goes here
- text goes here
- text goes here
- text goes here


Swiftly, Inc.
2261 Market Street #4151
San Francisco, CA 94114
©2026 Swiftly, Inc. All rights reserved.


It looks like you're located in Spain.
¿Quieres visitar nuestro sitio web en español?
