August 3, 2020
Swiftly’s Speed Map Goes Hi-Res

Matt Fleck
Senior Product Marketing Manager

August 3, 2020
Swiftly’s Speed Map Goes Hi-Res
Matt Fleck
August 3, 2020
Swiftly’s Speed Map Goes Hi-Res
Matt Fleck
Senior Product Marketing Manager
Learning from the lockdowns
For many transit agencies, there’s been an unlikely silver lining of the COVID-related lockdowns: traffic congestion has virtually disappeared on city streets, allowing buses to travel according to their scheduled ‘true potential.’
As lockdowns end and traffic congestion returns, agencies will start to face the same operational challenges as before the pandemic. And in many cities, gridlock will be even worse than before. So how do agencies ensure they don’t fall into the same patterns that unraveled their ‘true potential’ before the lockdowns?
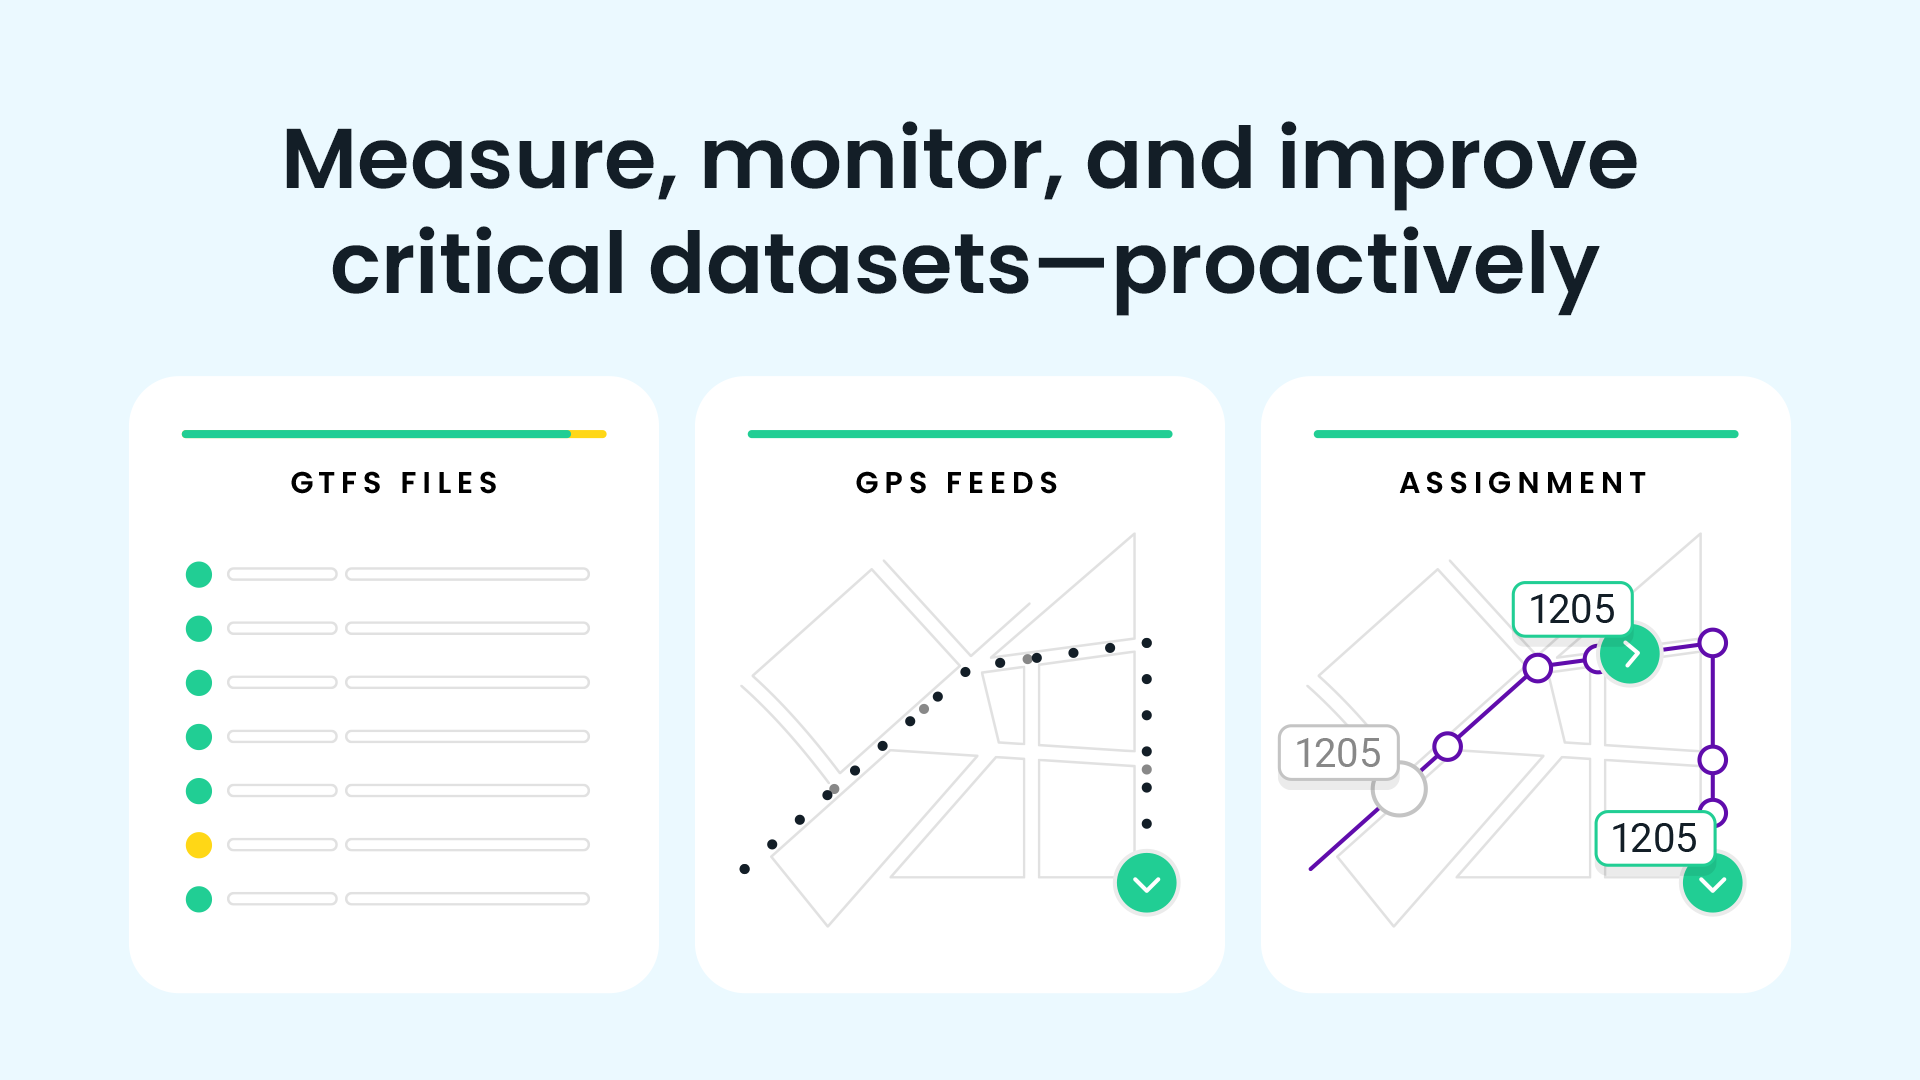
Today Swiftly is releasing an enhancement to the Speed Map module to help transit agencies make sense of this puzzle. Higher resolution is our answer.
More granularity, please! Speed Map Goes Hi-Res
Our Speed Map module already makes it easy to see your historical vehicle speeds between stops, allowing you to quickly identify choke points and prioritize which intersections would benefit from projects like transit-signal priority and devoted bus lanes.
We’ve now taken it one step further with our new High-Resolution Speed view by adding extra granularity. In addition to the average stop-to-stop speeds in our classic Speed Map view, you can now see your vehicle speeds at significantly smaller intervals between stops as well.
Have slowdowns continued to occur at specific intersections despite congestion-free conditions? Would certain corridors benefit from “emergency bus lanes” like the ones set up by SFMTA or the MBTA? The High-Resolution Speed view can inform these types of decisions as traffic conditions slowly return.

Here are some common use cases of the High-Resolution Speed view:
Commuter lines and express routes.
- If you have portions of your routes with long stretches between stops, like commuter lines or express routes, the High-Resolution Speed view provides a finely-drawn picture of vehicle speeds between stops.
Emergency bus lanes for COVID-19.
- Physical distancing guidelines mean that buses can carry only a fraction of their usual passenger load. Where one bus could suffice before the pandemic, three or four buses are now needed to move the same number of people. SFMTA and the MBTA have created emergency bus lanes to increase throughput on their busiest corridors. The High-Resolution Speed view simplifies the process of prioritizing corridors for emergency bus lanes by showing which segments and intersections are suffering from unnecessary slowdowns.
Prioritizing “micro-projects.”
- If dedicated bus lanes are too big of an ask, our High-Resolution Speed view also helps you identify intersections that would benefit from transit signal priority ‘micro-projects.’ To find candidate intersections, simply look for red in your network and analyze how speed conditions change throughout the day.
Before-and-after studies.
- The Speed Map has always been an excellent resource for before-and-after studies. We’ve heard that it’s especially helpful during that point in a project when changes have been implemented, but it’s too early to do a full impact review. The High-Resolution Speed view will now add power to this type of analysis by helping planners zero in on the specific zones of improvement, which they can use to target the next set of projects. Our Speed Map is also a visual, intuitive way to present your speed data to the public, policy makers, and the stakeholders who approve grants that fund speed-boosting improvement projects.
A window into the passenger experience
Travel speeds tell the story of the passenger experience. Like excess wait time, perceived travel time plays a role in whether the public use transit and how they rate their experience. Speed and reliability is what keeps transit competitive, and understanding where those two indicators dip is crucial to deciding where to spend your capital dollars and political will.
Slow speeds are also costly. When vehicles are slower, transit agencies have to spend more hours to cover the same miles. Even seconds can accrue fast over the course of millions of miles per year. The ability to zero in on a stop segment has always been a hallmark of the speed map but this update takes it to a new level.
With the High-Resolution Speed Map, now you can get granular about boosting vehicle speeds within your network.
Want to see how these modules could work at your agency? Reach out to us today!
Request a demo
The rich text element allows you to create and format headings, paragraphs, blockquotes, images, and video all in one place instead of having to add and format them individually. Just double-click and easily create content.
Last Name, Agency

What’s a Rich Text element?
What’s a Rich Text element?
What’s a Rich Text element?
What’s a Rich Text element?
What’s a Rich Text element?
The rich text element allows you to create and format headings, paragraphs, blockquotes, images, and video all in one place instead of having to add and format them individually. Just double-click and easily create content.
Last Name, Agency
Static and dynamic content editing
A rich text element can be used with static or dynamic content. For static content, just drop it into any page and begin editing. For dynamic content, add a rich text field to any collection and then connect a rich text element to that field in the settings panel. Voila!
How to customize formatting for each rich text
Headings, paragraphs, blockquotes, figures, images, and figure captions can all be styled after a class is added to the rich text element using the "When inside of" nested selector system.
- text goes here
- text goes here
- text goes here
- text goes here
- text goes here
- text goes here


Swiftly, Inc.
2261 Market Street #4151
San Francisco, CA 94114
©2026 Swiftly, Inc. All rights reserved.


It looks like you're located in Spain.
¿Quieres visitar nuestro sitio web en español?
