October 2, 2020
Remix and Swiftly partner to bring better transit data to cities

Morgan Greene
Senior Director, Marketing

October 2, 2020
Remix and Swiftly partner to bring better transit data to cities
Morgan Greene
October 2, 2020
Remix and Swiftly partner to bring better transit data to cities
Morgan Greene
Senior Director, Marketing
Your transit agency is a deep well of data that can guide you in planning and executing the best service for your community. Unfortunately, much of the transit industry doesn’t think of your transit data as your transit data. Most transit software companies design their software with a closed, proprietary system in mind. This means you often have to look in 4 or 5 transit tools just to get to the heart of a single question. This barely sufficed even in the best of times, but within the rapidly changing environment of COVID-19, agencies simply don’t have the time to switch between multiple systems to answer one question. That’s why Swiftly and Remix want to give you access to the best data wherever you want to see it.
Your data, wherever you want it
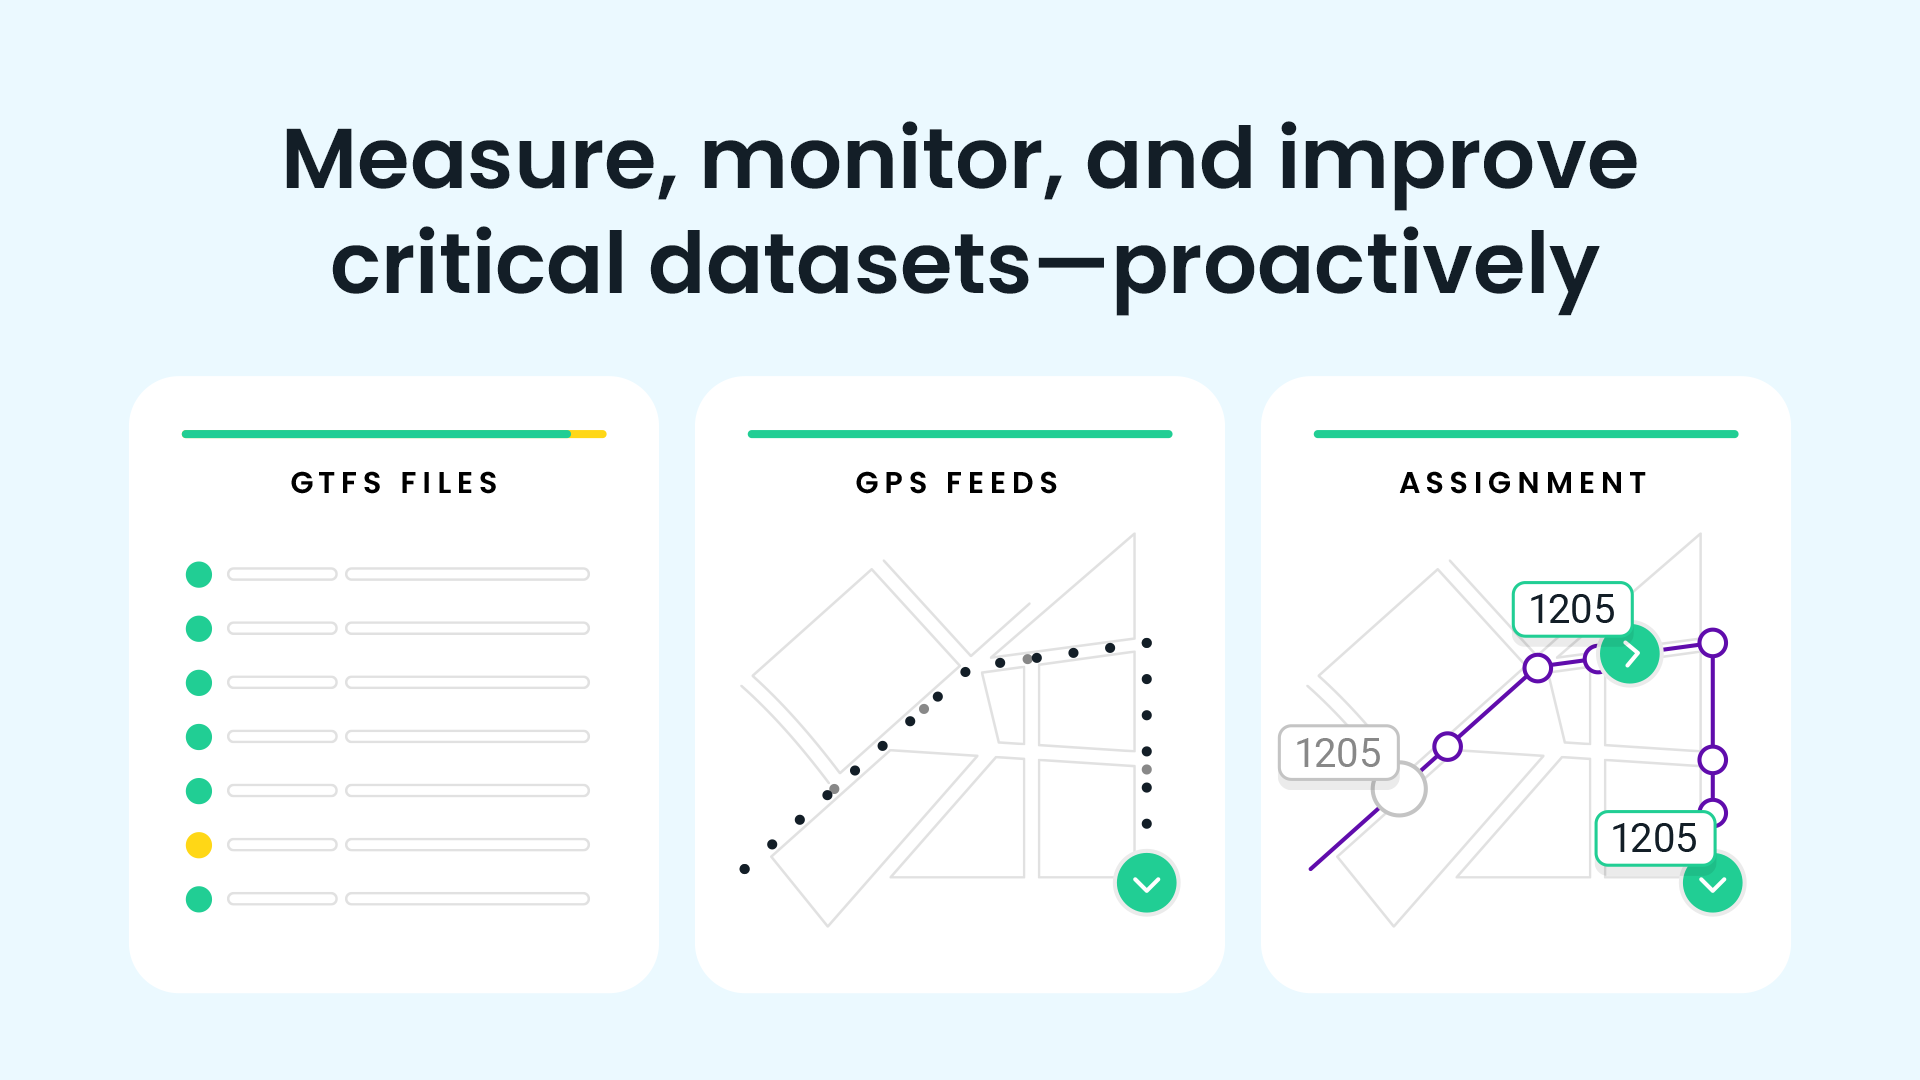
We’re excited to announce a new partnership between Swiftly and Remix that will allow you to visualize the historical speed and dwell time data that Swiftly analyzes inside Remix’s Transit product. This means you’ll get Swiftly’s best-in-class historical speed data in Remix’s best-in-class planning tool. Win-win! And this is just the beginning.

Here are a few examples of how these tools can be used together:
Emergency bus lanes for COVID-19.
- Social distancing guidelines mean that buses can carry only a fraction of their usual passenger load. Where one bus could suffice before the pandemic, three or four buses are now needed to move the same number of people. Swiftly’s historical bus speed data paired with Remix’s historical ridership data visualizations and frequency/cost tradeoff analyses can help planners determine where to prioritize these interventions and communicate with key stakeholders.
Prioritizing “micro-projects.”
- Capital projects are expensive and take years to realize. Leverage Swiftly speed data and Remix’s historical ridership and passenger load visualizations to identify corridors where small adjustments could dramatically speed up service for many passengers.
Stop optimization.
- Swiftly’s historical dwell time in Remix’s transit planning tools can help planners analyze and justify potential bus stops for consolidation or optimization as well as identify candidates for Bus Rapid Transit (BRT).
Transit Signal Priority (TSP).
- Swiftly’s historical speed data paired with Remix’s ridership data helps planners to determine and present opportunities for TSP.
Consensus-building.
- Planners use Swiftly data and Remix visualizations for public outreach and consensus building around capital projects. Remix provides a platform for collaboration across internal and external stakeholders so that important decisions can be made with the actual data your agency has.
Before-and-after studies.
- Planners often use Swiftly historical speed data to rapidly test the effectiveness of a project with current data. Remix’s holistic platform visualizes speed data in the broader transportation context for thoughtfully designed proposals.
Remix and Swiftly are committed to giving agencies more flexibility access to their data through data standards and open APIs. It’s your data after all. You should be able to see it where you want it.
Always informed by customer feedback
Here’s what our customers are saying:
“A Remix and Swiftly speeds visualization would help us prioritize where we spend our dollars.” —Nadia Barrera-Ramirez, Project Manager, Transit Speed & Reliability, Capital Metro, Austin
“A Remix and Swiftly speeds partnership would provide a quick way to analyze temporary treatments such as putting in a pop-up lane… helping MTA and the city DOT work together to really make this happen with data.” —Thomas Hewitt Jr, Director, Office of Service Development, MTA Baltimore
This will be available to all agencies who use both Swiftly Speed Map and Remix at no additional cost. Interested in learning more? Fill out this form.
Request a demo
The rich text element allows you to create and format headings, paragraphs, blockquotes, images, and video all in one place instead of having to add and format them individually. Just double-click and easily create content.
Last Name, Agency

What’s a Rich Text element?
What’s a Rich Text element?
What’s a Rich Text element?
What’s a Rich Text element?
What’s a Rich Text element?
The rich text element allows you to create and format headings, paragraphs, blockquotes, images, and video all in one place instead of having to add and format them individually. Just double-click and easily create content.
Last Name, Agency
Static and dynamic content editing
A rich text element can be used with static or dynamic content. For static content, just drop it into any page and begin editing. For dynamic content, add a rich text field to any collection and then connect a rich text element to that field in the settings panel. Voila!
How to customize formatting for each rich text
Headings, paragraphs, blockquotes, figures, images, and figure captions can all be styled after a class is added to the rich text element using the "When inside of" nested selector system.
- text goes here
- text goes here
- text goes here
- text goes here
- text goes here
- text goes here


Swiftly, Inc.
2261 Market Street #4151
San Francisco, CA 94114
©2026 Swiftly, Inc. All rights reserved.


It looks like you're located in Spain.
¿Quieres visitar nuestro sitio web en español?
