planning
Spend your time improving service, not pulling data
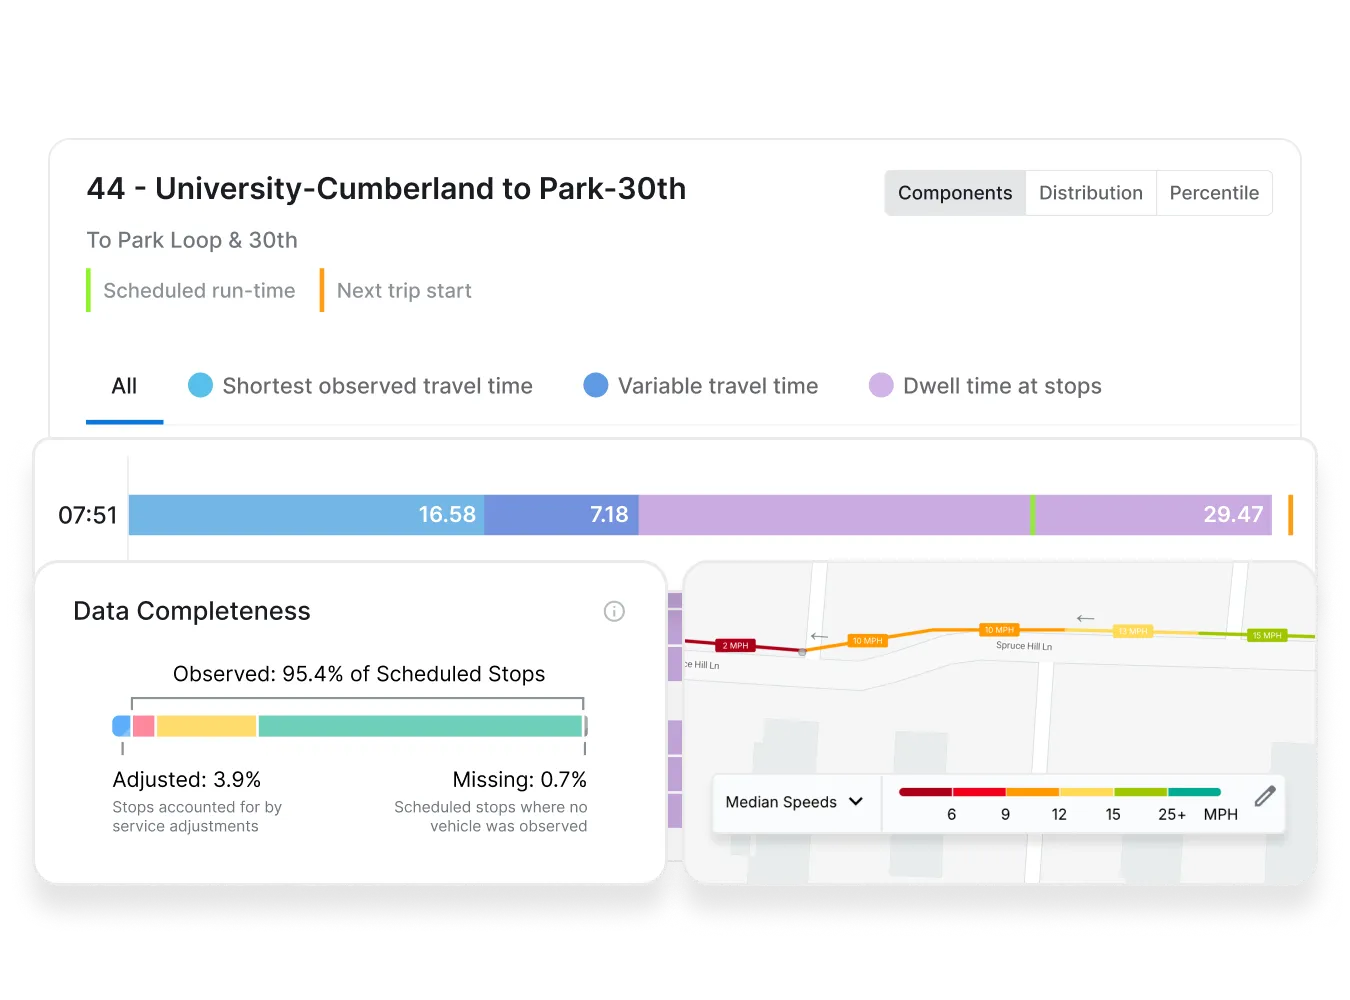
Swiftly gives planning teams an accurate picture of service performance for more efficient, comprehensive analysis. Every planning decision is grounded in granular data, not assumptions.

Trusted by 200+ transit agencies worldwide

















Plan with data you can stand behind
Swiftly gives planning teams reliable data and flexible tools to make confident decisions, faster. Staff spend less time gathering data, checking accuracy, and building reports, and more time making improvements to service.
30%
More riders with access to frequent transit
And 28% more jobs and destinations accessible by transit, based on results from a data-driven network redesign.
700x
Increase in historical trip data over ride checks
100%
Client success rate for APC NTD certification
40%
Increase in route ridership with data-informed planning
Ridership
Prioritize service improvements by rider impact
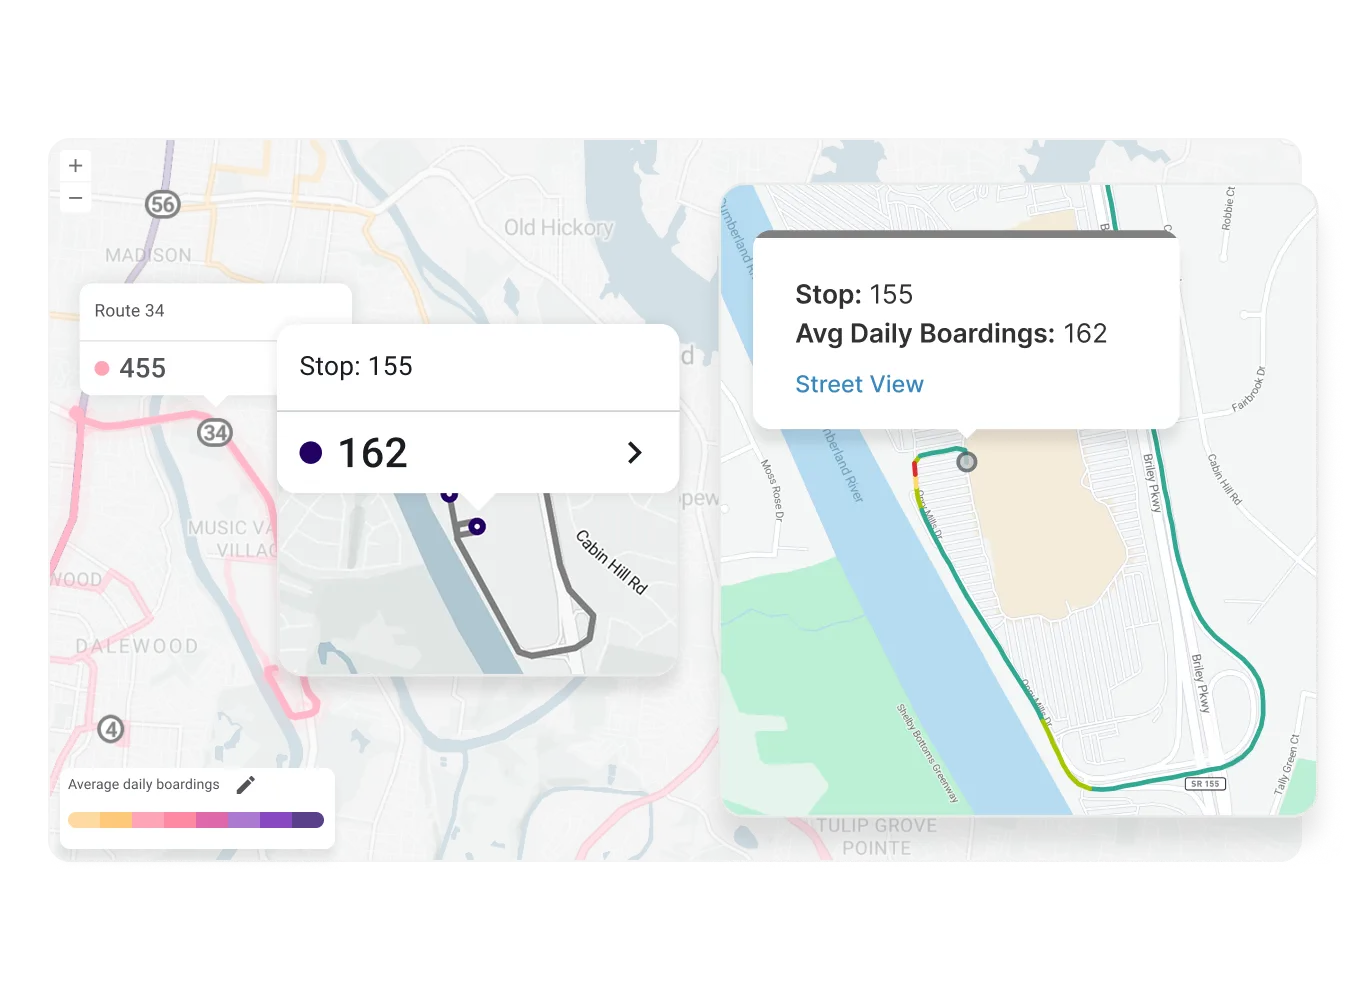
Swiftly is the only platform to show how and where slow-downs and poor reliability impact riders. Planners can identify and prioritize improvements to benefit the most riders, weighing short and long-term goals.
Run-Times + Speed Map
Make planning decisions backed by real-world data
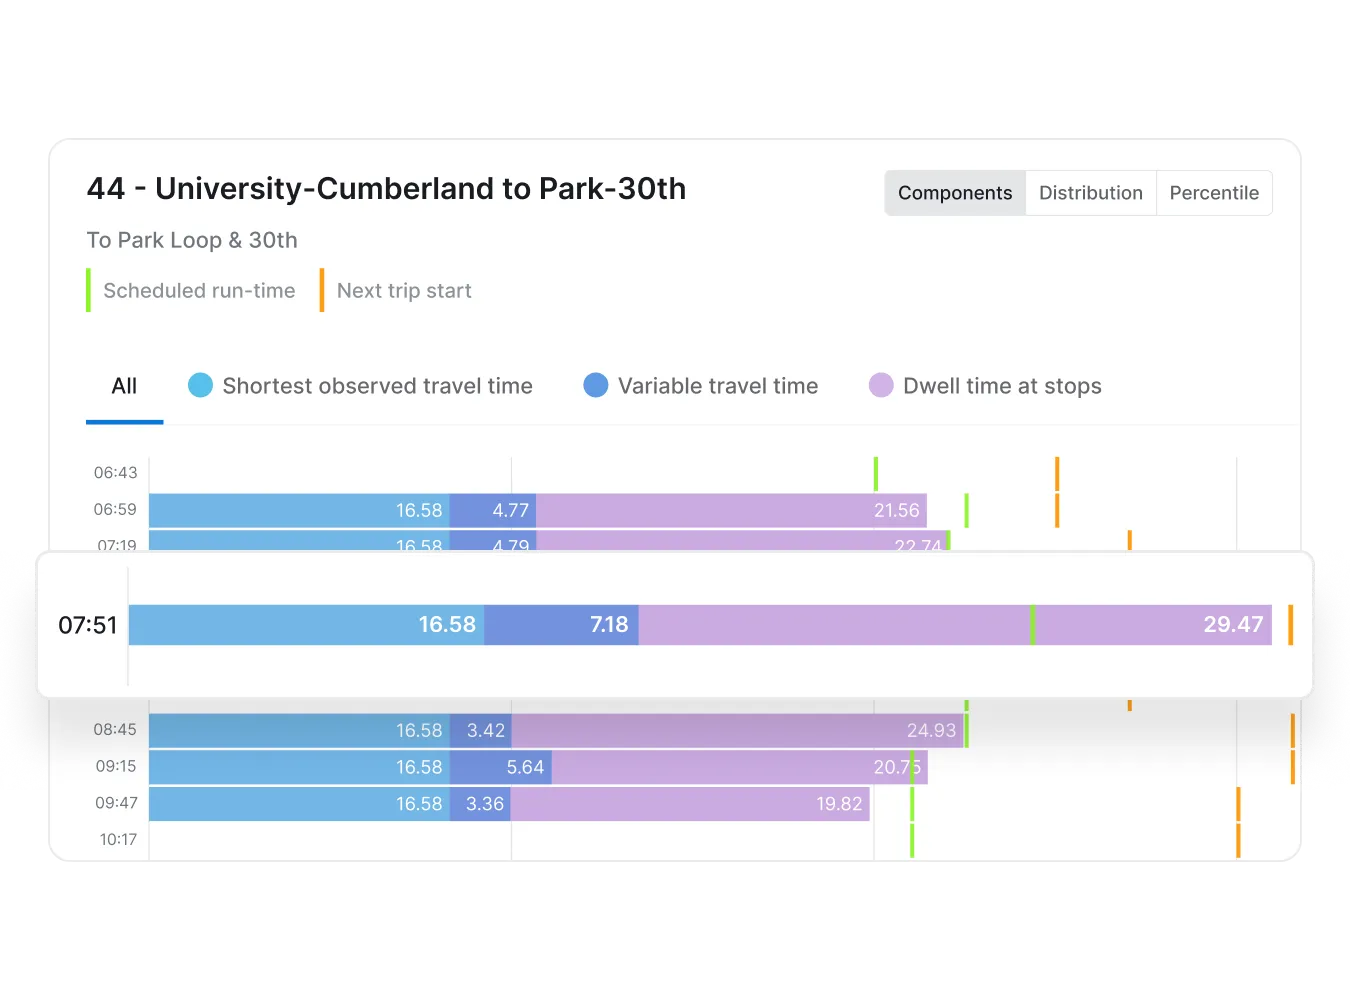
Get the reports you need to identify problem areas in the network, validate rider feedback, and measure the impacts of infrastructure improvements. Analyses that used to take months now take hours.
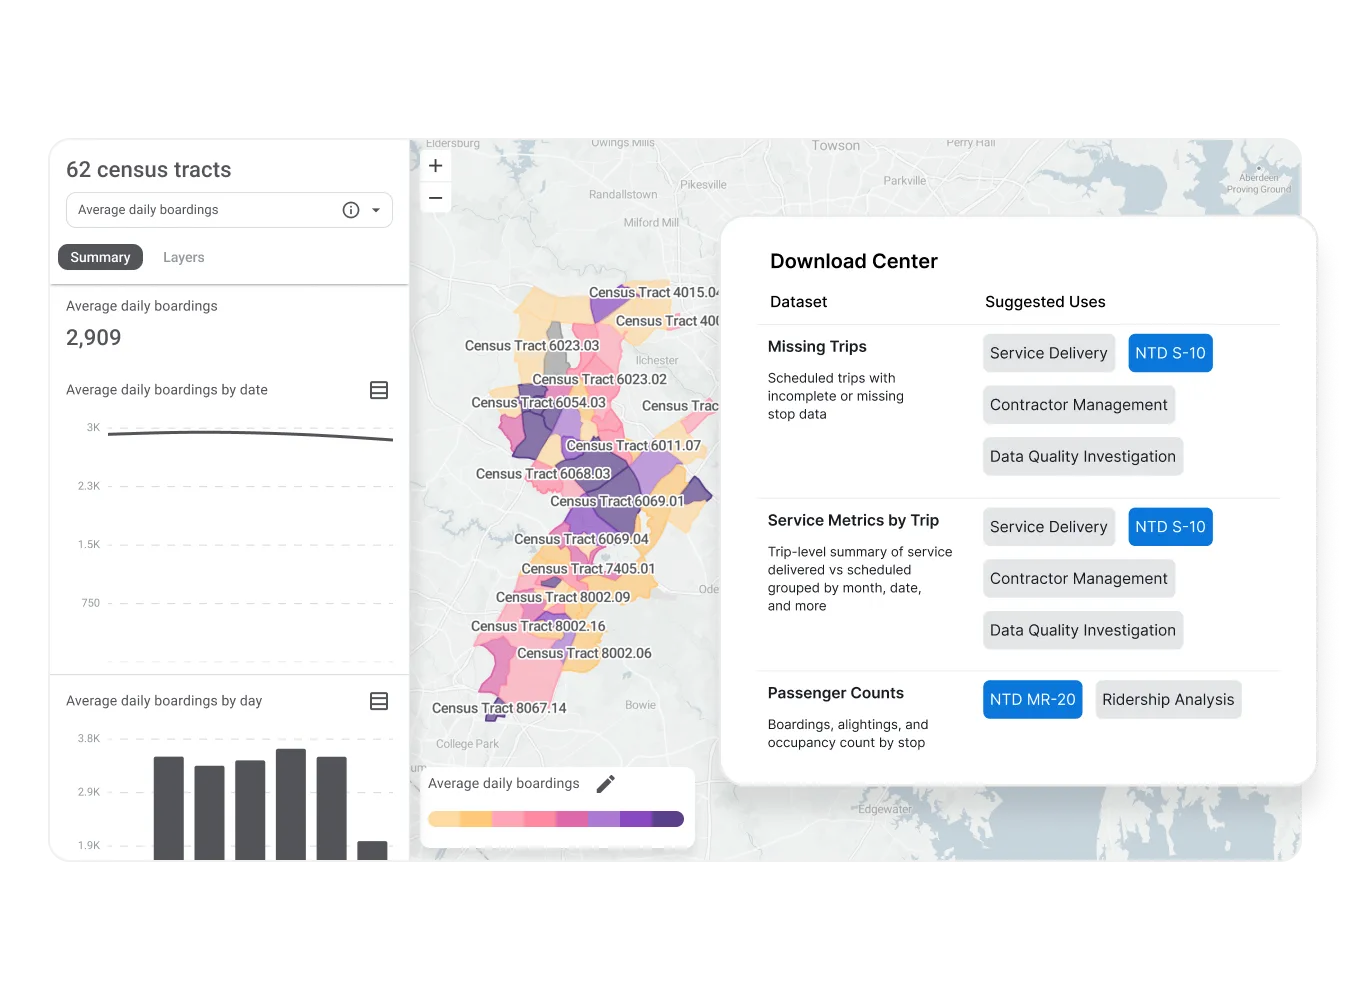
NTD-Ready reports
Defend budgets and funding requests for your communities
Make funding requests, equity analyses, and board presentations with confidence. Swiftly gives planning teams NTD-ready reporting, custom geographic layers for Title VI, and performance data to connect every decision to rider impact.
CASE STUDIES
Powering the cities that move the world
Transit agencies of all sizes rely on Swiftly’s Transit Data Platform to improve the rider experience, boost service reliability, and operate more efficiently.


Miami-Dade Transit
Reliable data informs historic network redesign
Miami-Dade Transit and Jarett Walker + Associates relied on Swiftly data to inform their Better Bus Network redesign, giving the average resident access to 28% more jobs and useful destinations.
30%
more access to frequent transit
3.5%
system-wide OTP improvement
10%
improvement on priority routes

Miami-Dade Transit
We used Swiftly data to inform and monitor the success of our network redesign. That was a really good, quick, and easy way of checking, ‘Did we get this right?’
Linda Morris
,
Chief of Service Planning


NCTD
Ridership-aware planning
NCTD implemented Swiftly Ridership for NTD reporting and to inform planning decisions, driving new ridership gains.
7.6%
Increase in reported ridership
47%
Increase on an updated line
100%
NTD certification success rate


Jarrett Walker + Associates
Swiftly provided detailed speed data for existing routes, allowing us insights into better drive time assumptions in the planning process for Miami's Better Bus Network.
Scudder Wagg
,
Principal Associate
Decision-making tools planning teams rely on

Ridership built into every analysis
Overlay ridership and performance data. Planners see not just where service is slow, but how many riders feel it.

Route analysis in minutes, not months
Understand network trends, and investigate route performance to prioritize improvements and infrastructure investments.

Data boards and stakeholders trust
Make decisions grounded in reliable performance and ridership data, backed by our 100% NTD certification success rate.