reporting & insights
Provide service riders can count on
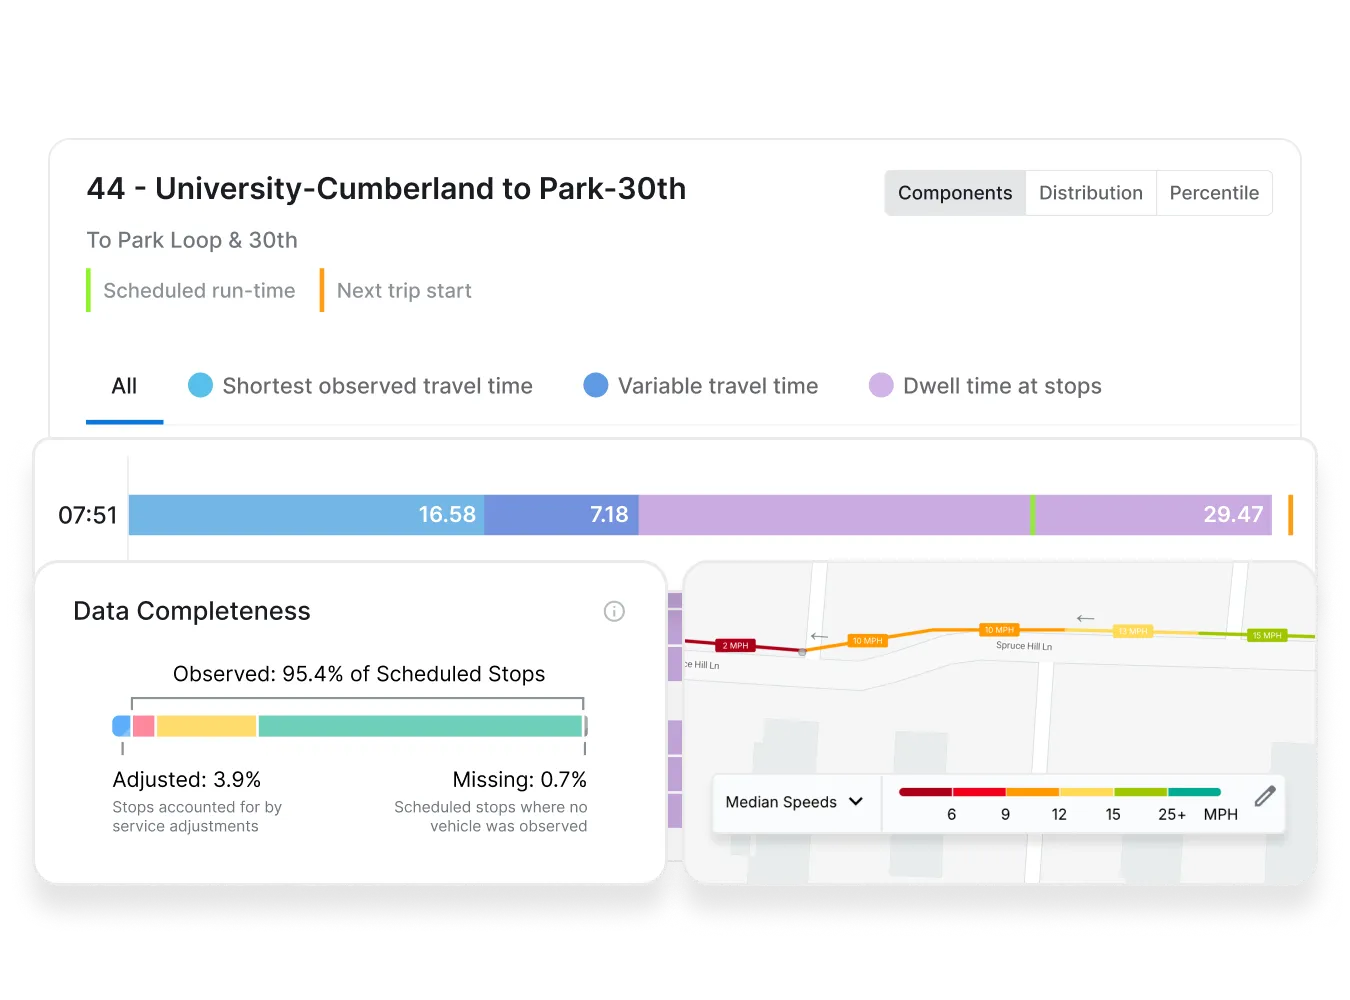
Empower Planning, Scheduling, and Operations teams with a complete and accurate view of network performance. Identify problem areas, make targeted improvements, and keep riders coming back to transit.

Trusted by 200+ transit agencies worldwide














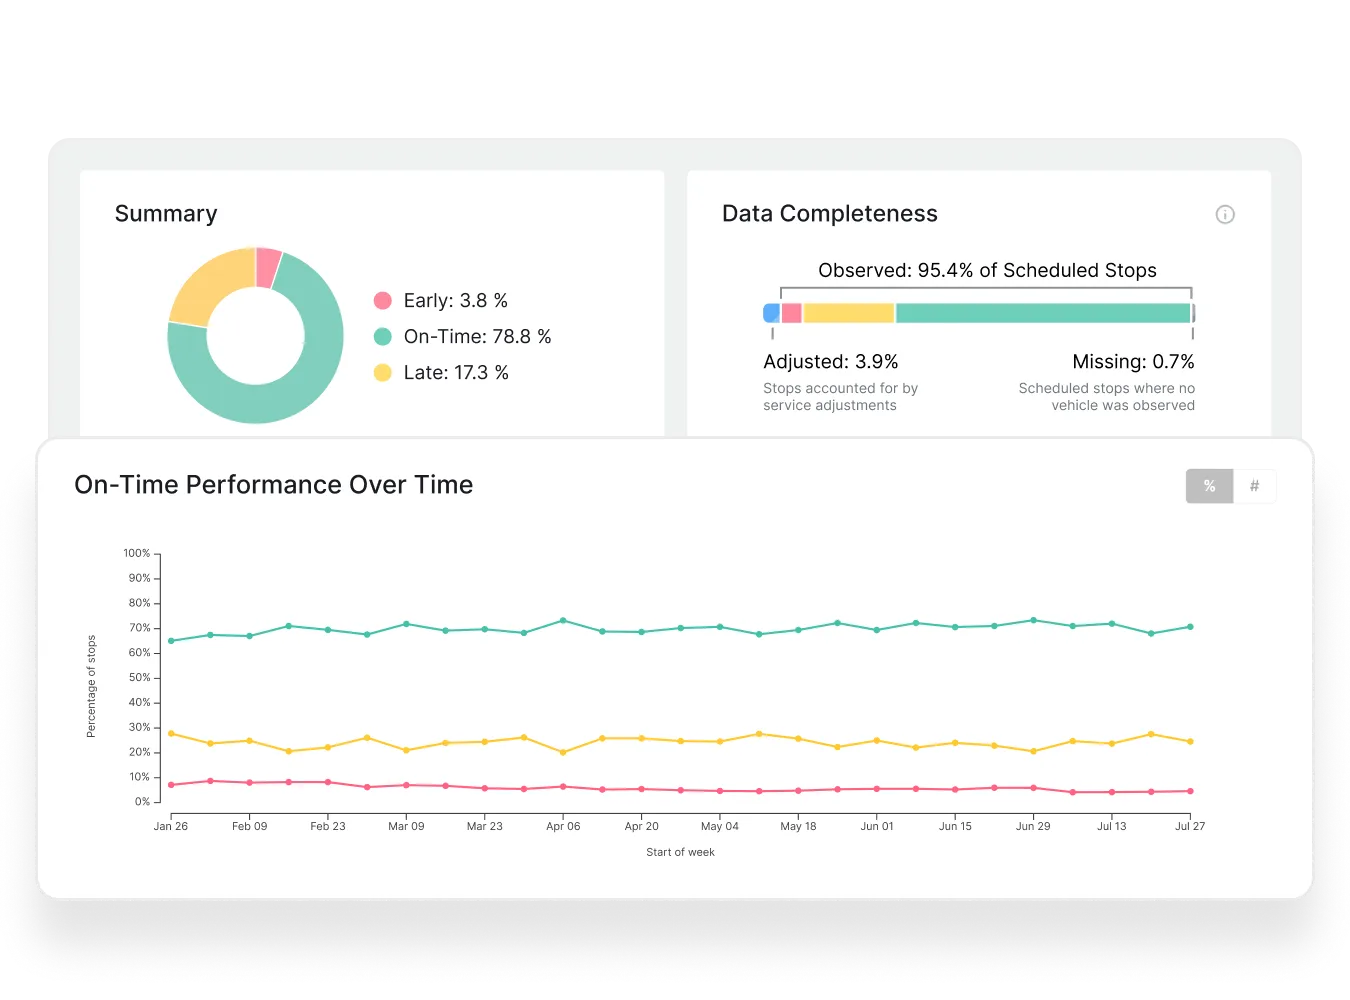
On-Time Performance
Identify reliability issues—and how to fix them
See detailed, flexible on-time performance reporting across every stop. Identify problem areas in your network and make the fixes that will impact riders most.
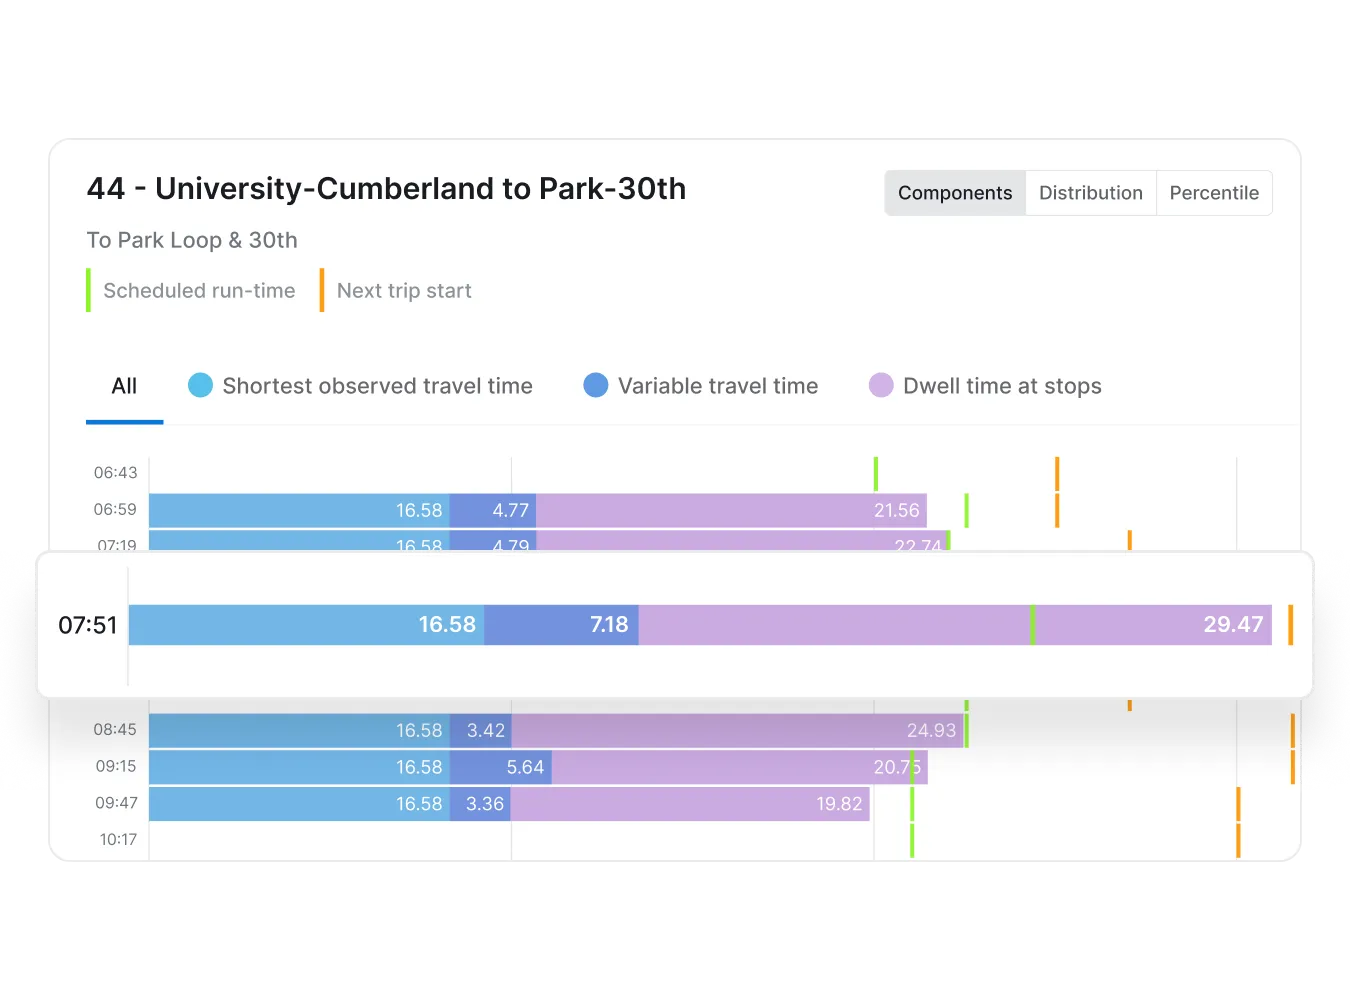
Run-Times
Build your schedules around how service actually runs
Compare historical and scheduled run-time data at the stop and route level. Identify unnecessary slack, align schedules with real-world service, and optimize layovers to improve reliability while cutting unnecessary costs.
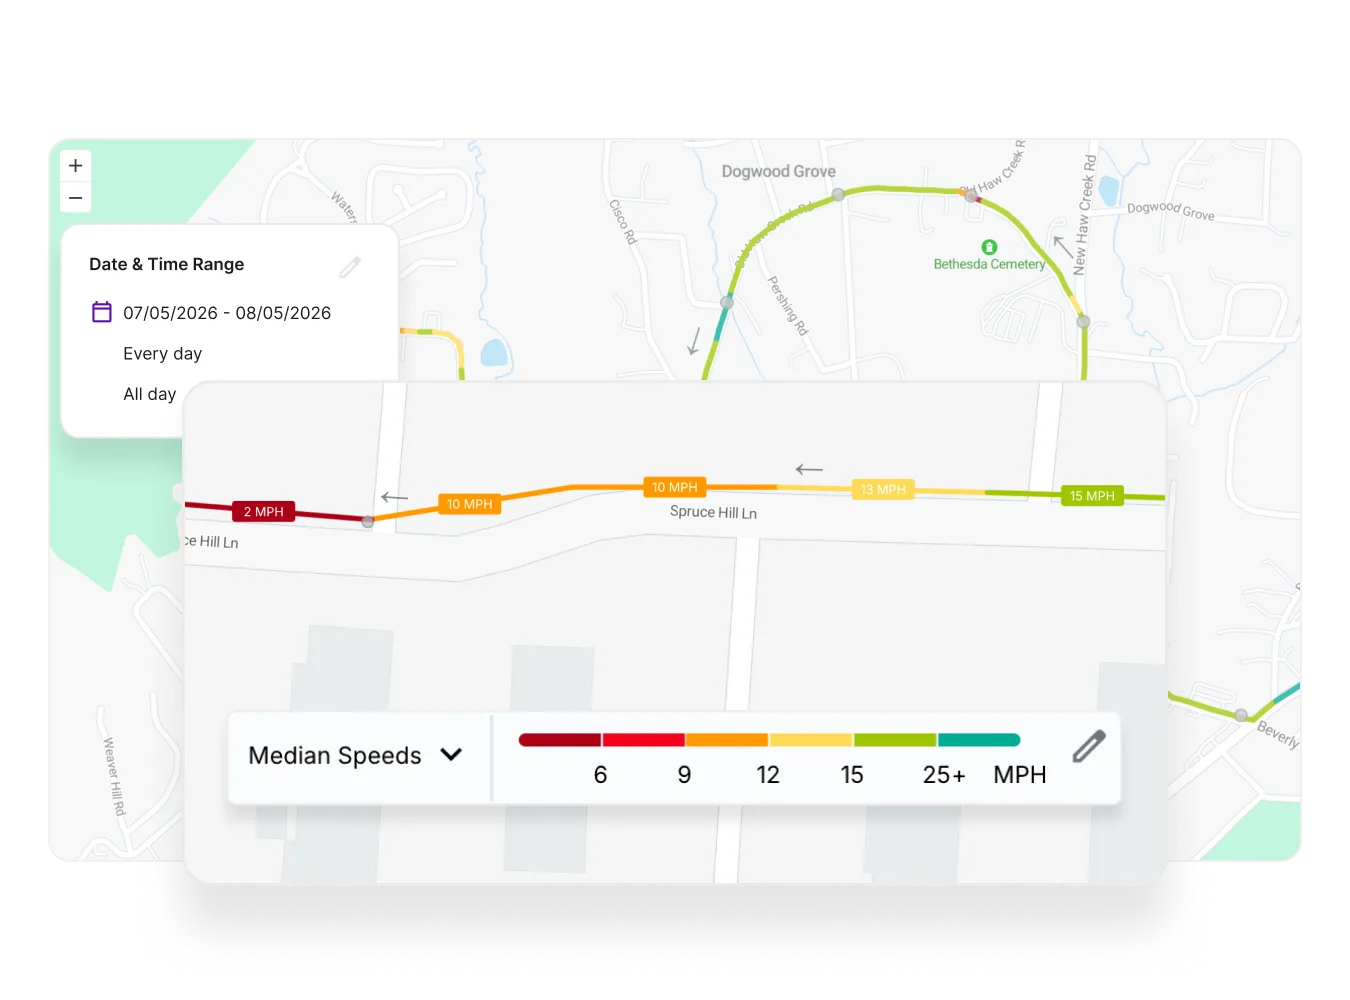
Speed Map
Pinpoint slow-downs and measure speed improvements
Speed Map overlays historical travel speeds across your network so you can spot where infrastructure improvements will have the most impact—and then measure the results.
Ridership
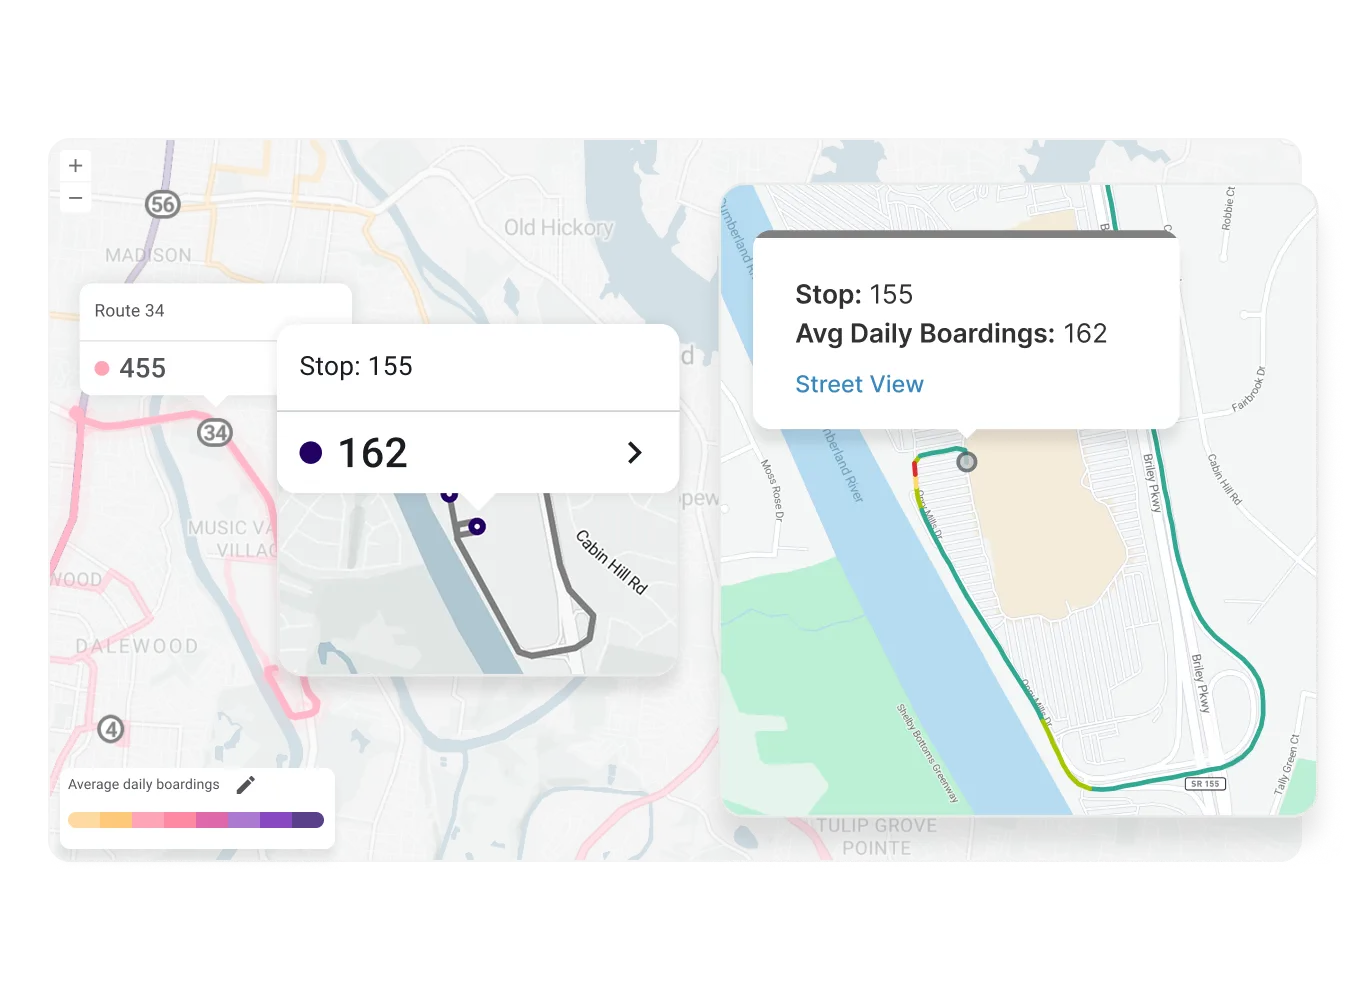
Understand ridership trends in your service area
Visualize ridership alongside performance data to understand how reliability impacts your riders. Report on ridership increases, prioritize investments, and defend budget decisions with confidence.
Headways
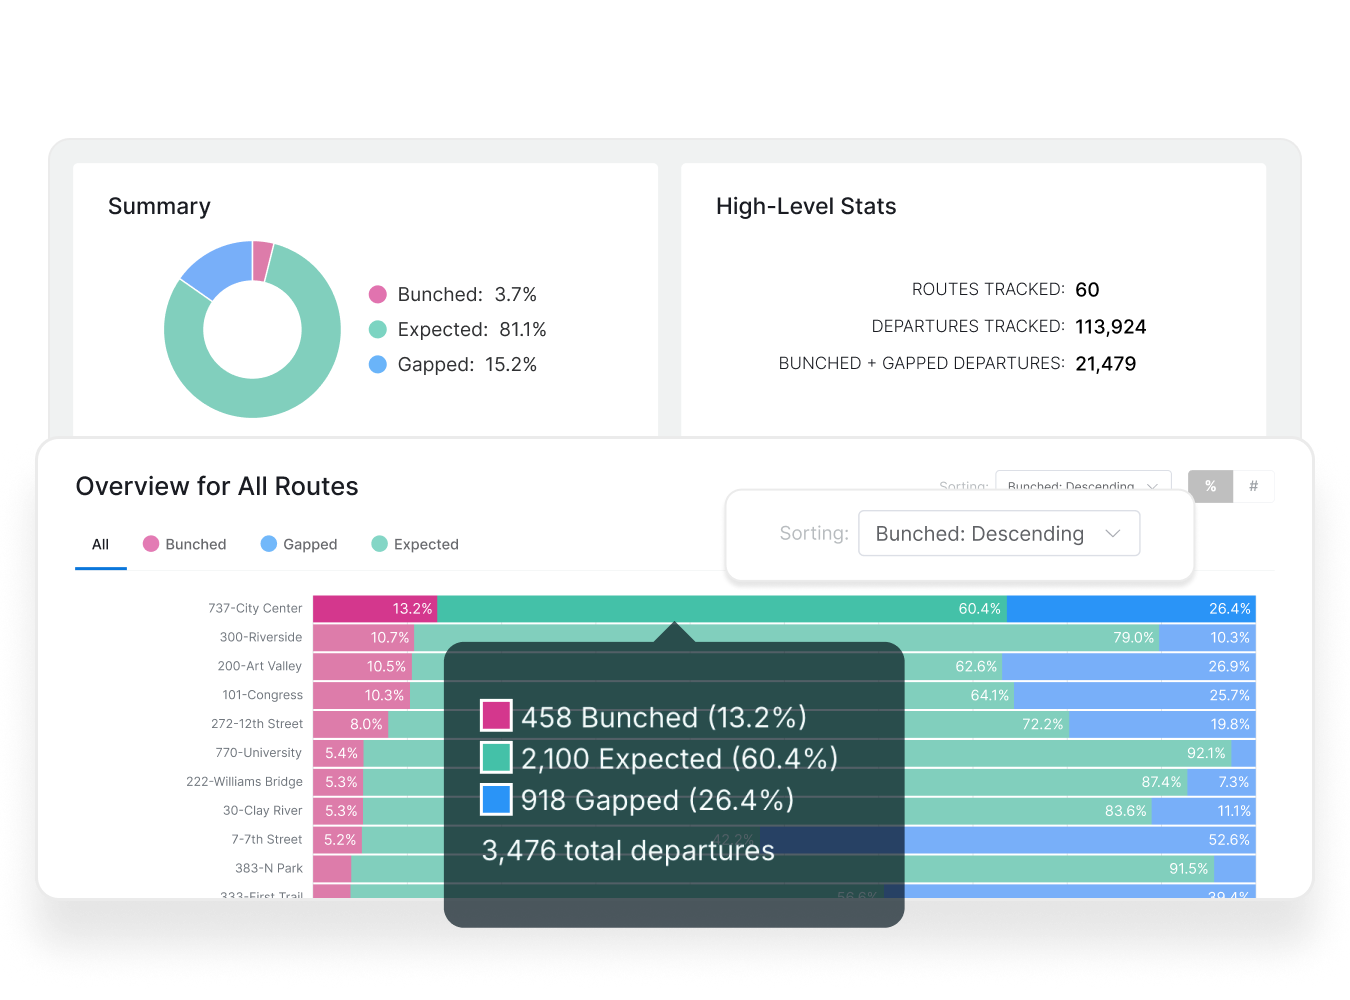
Shorten wait times with reliable headways
Headways shows where bunching and gapping occur by route, stop, and time of day—so you can target the reliability problems your riders feel the most.
Operator reports
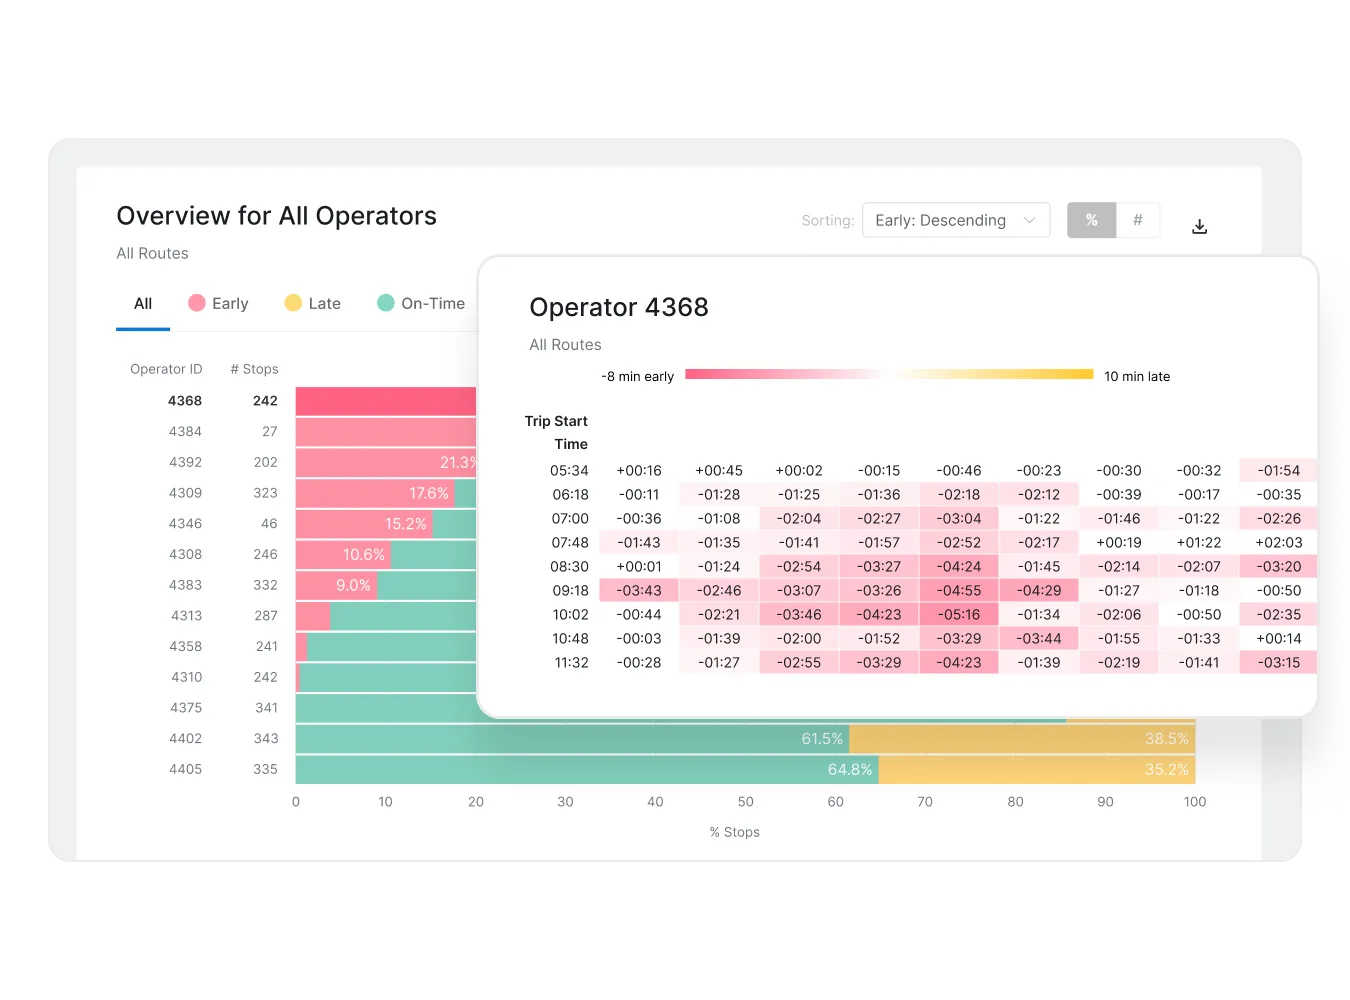
Coach operators with real-world performance data
Operator Reports shows on-time performance at the individual level. Identify who needs coaching and when the issue is the schedule, not the operator.
GPS Playback
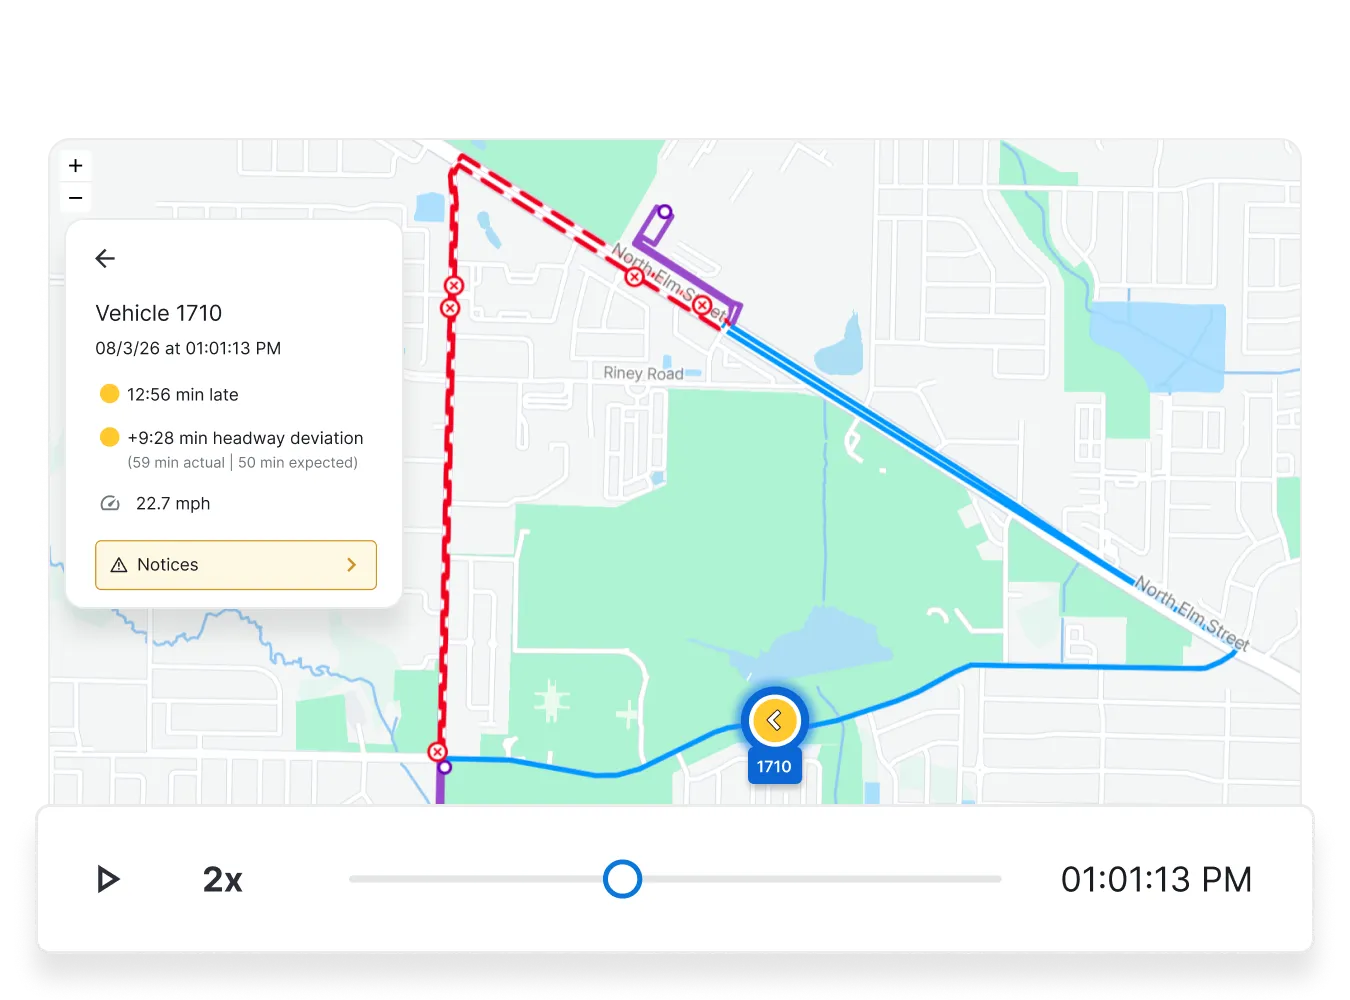
Go beyond the data to investigate reliability issues
Replay any vehicle’s movements on any route, in seconds. GPS Playback gives your team the context behind the numbers and graphs.
transit data platform
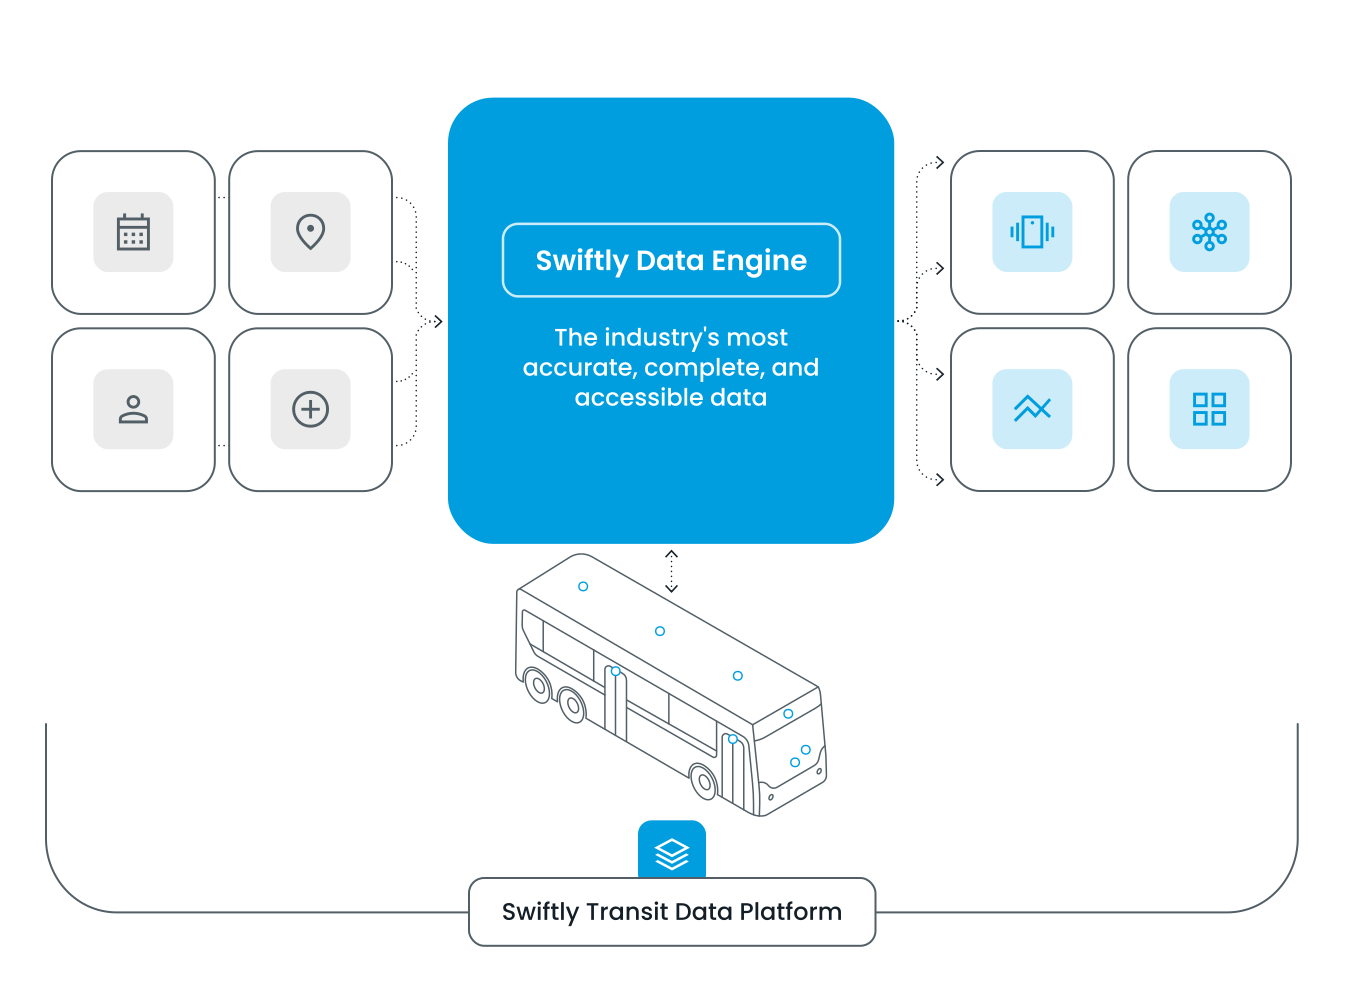
A single data source for all departments
Swiftly connects ridership, performance, and real-time data in a single platform. Planning, Scheduling, Operations teams can work together from the same source of truth to improve the rider experience.
Why agencies choose Swiftly for reporting and insights
Reliable data
The Swiftly Data Engine tracks every vehicle’s performance with precise GPS data and algorithms, so reports capture what actually happened for every stop.

Actionable insights
Teams no longer need to spend days or weeks analyzing a single route. Immediately surface problem areas to make targeted improvements.

Rider impact
Swiftly is the only platform to display ridership data alongside performance metrics, so you can measure the impact of service issues (and improvements) on riders.
CASE STUDIES
Powering the cities that move the world
Transit agencies of all sizes rely on Swiftly’s Transit Data Platform to improve the rider experience, boost service reliability, and operate more efficiently.


Miami-Dade Transit
Reliable data informs historic network redesign
Miami-Dade Transit and Jarett Walker + Associates relied on Swiftly data to inform their Better Bus Network redesign, giving the average resident access to 28% more jobs and useful destinations.
30%
more access to frequent transit
3.5%
system-wide OTP improvement
10%
improvement on priority routes


Valley Metro
Targeted changes to improve reliability and efficiency
The scheduling team used Swiftly data and reports to optimize routes, improving on-time performance (OTP) and eliminating excess run-times
10%
system-wide OTP improvement
20%
slack eliminated from the schedule
25%
OTP improvement on priority routes


NCTD
Ridership-aware planning
NCTD implemented Swiftly Ridership for NTD reporting and to inform planning decisions, driving new ridership gains.
7.6%
Increase in reported ridership
47%
Increase on an updated line
100%
NTD certification success rate

Miami-Dade Transit
We used Swiftly data to inform and monitor the success of our network redesign. That was a really good, quick, and easy way of checking, ‘Did we get this right?’
Linda Morris
,
Chief of Service Planning

CTtransit
We used Swiftly to adjust schedules and improve on-time performance. Swiftly validates what operators tell us, so we can adjust recovery time and make impactful changes.
Justin Cayless
,
AGM of Transit Services
One Transit Data Platform for every team
Operations
Shift from reactive to proactive operations. Handle whatever the day throws at you with Swiftly’s real-time tools.

Operations
Planning
Spend time improving service, not pulling data. Ground every planning decision in granular data, not assumptions.

Planning
Scheduling
Build schedules around how service actually runs. Give schedulers a detailed picture of real-world performance.

Scheduling
Featured Resource
6 real-world lessons from agencies facing budget pressure
Explore 6 proven strategies that help agencies when budgets tighten.