operations
Handle whatever the day throws at you
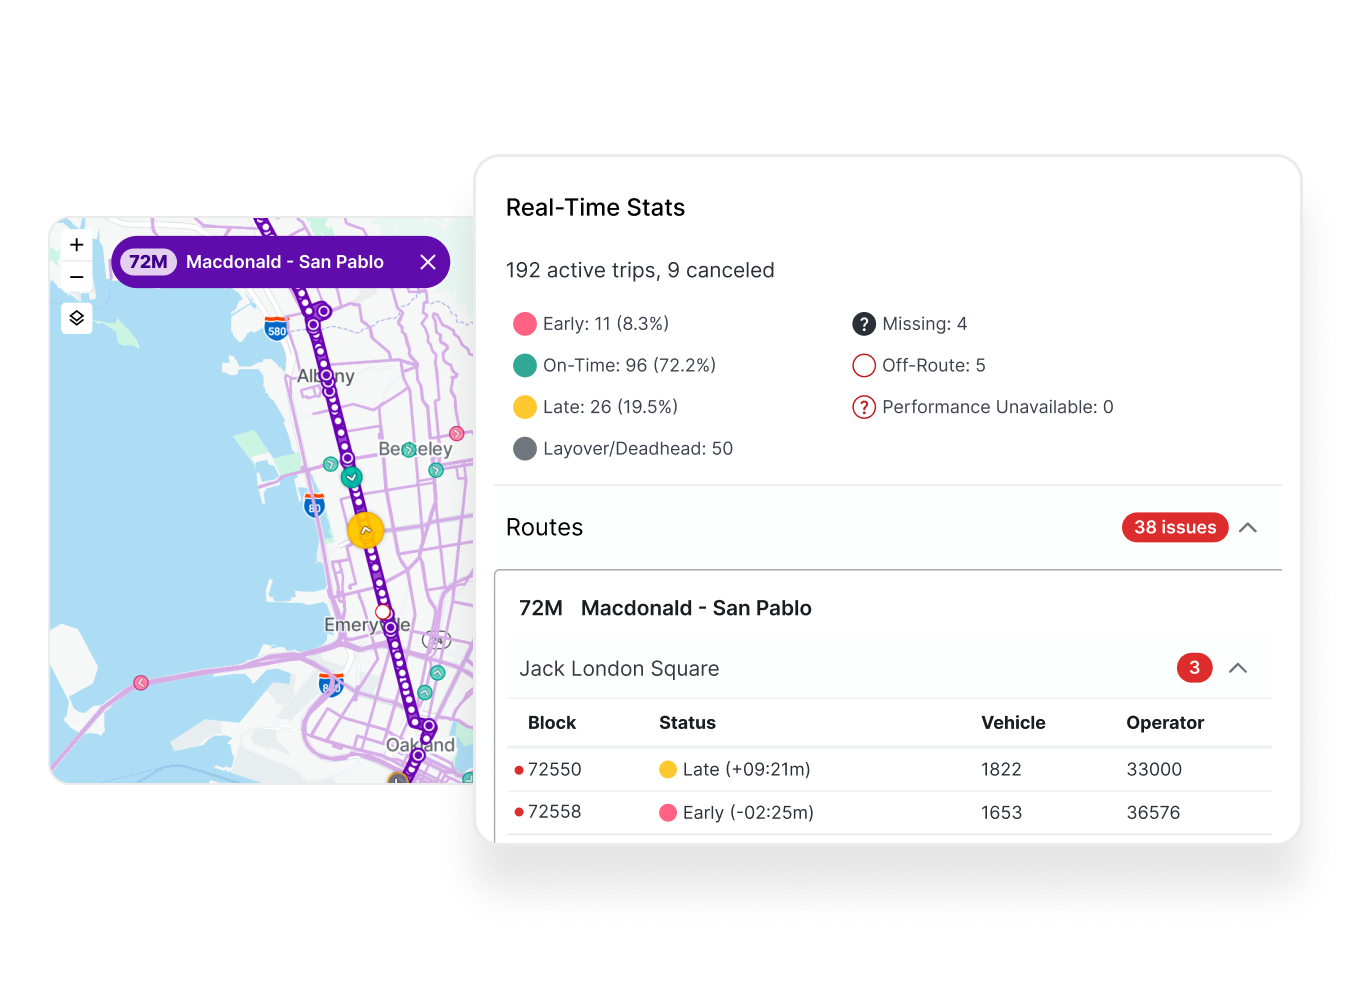
Swiftly’s real-time tools connect detection, coordination, and response in one place, so your team meets whatever comes up without missing a beat.

Trusted by 200+ transit agencies worldwide











Operations teams catch problems earlier and fix them faster
You’ve spent your shift jumping between spreadsheets, radio chatter, and gut instinct, trying to piece together what’s actually happening. Swiftly just shows you.
40%
Improvement in on-time performance
Swiftly’s reliable data and agile tools empower operations teams to proactively manage service reliability.
+50%
Reduction in early departures
210+
Staff hours saved per year entering disruption information
10%
More fleet visibility with Auto-Assigner
live operations
Catch issues before they ruin your day
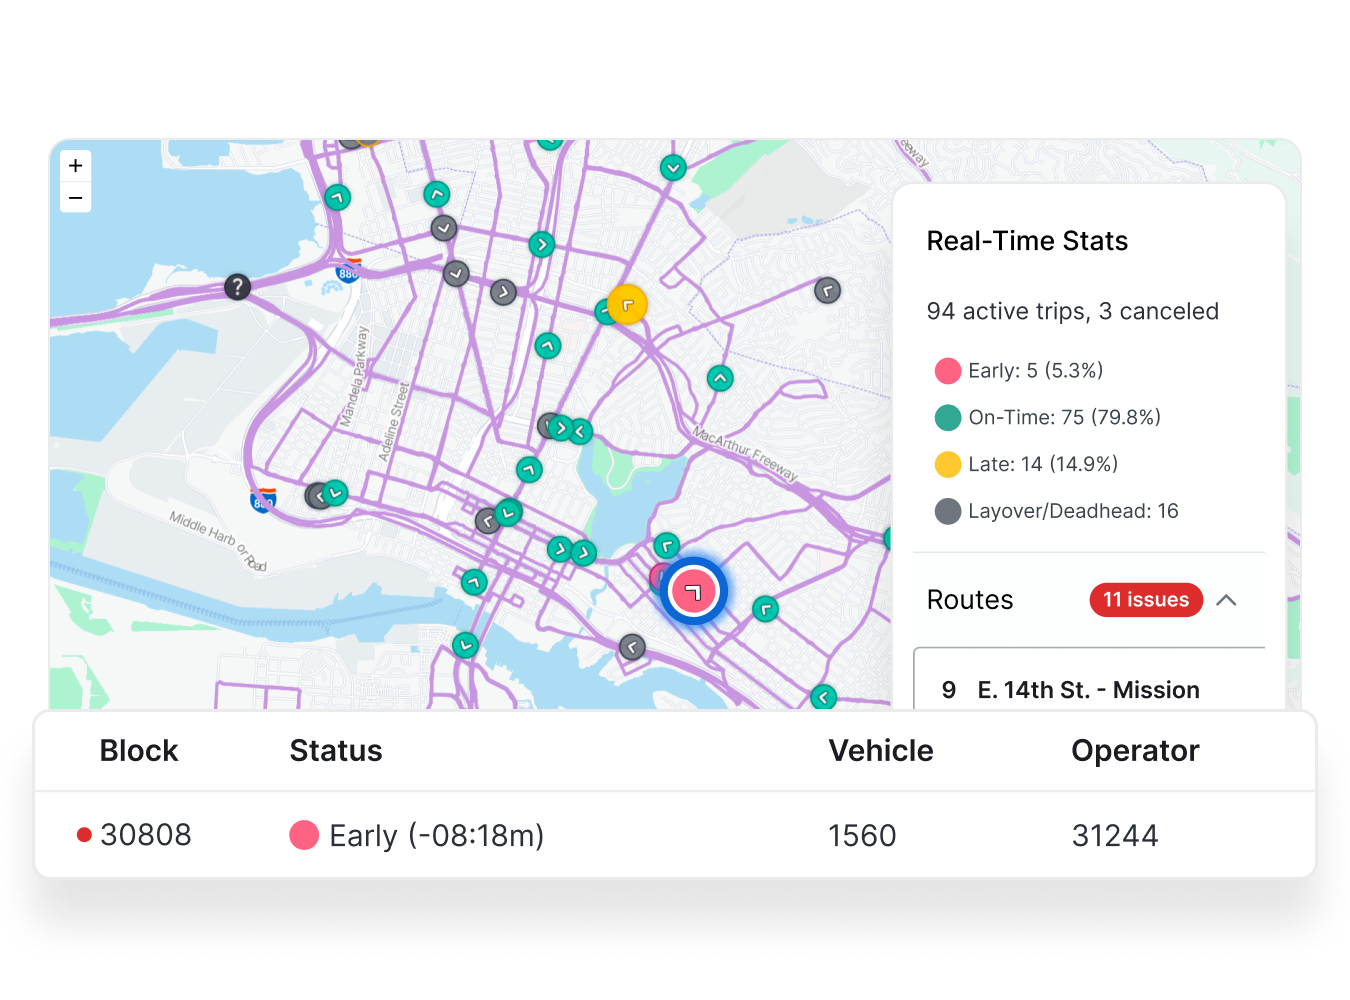
Swiftly flags the small stuff early: a vehicle running hot, a gap opening, a bus drifting off route, back when it’s still one easy fix instead of a bunched corridor an hour from now.
communications
Coordinate calmly between dispatch, operators, and field staff
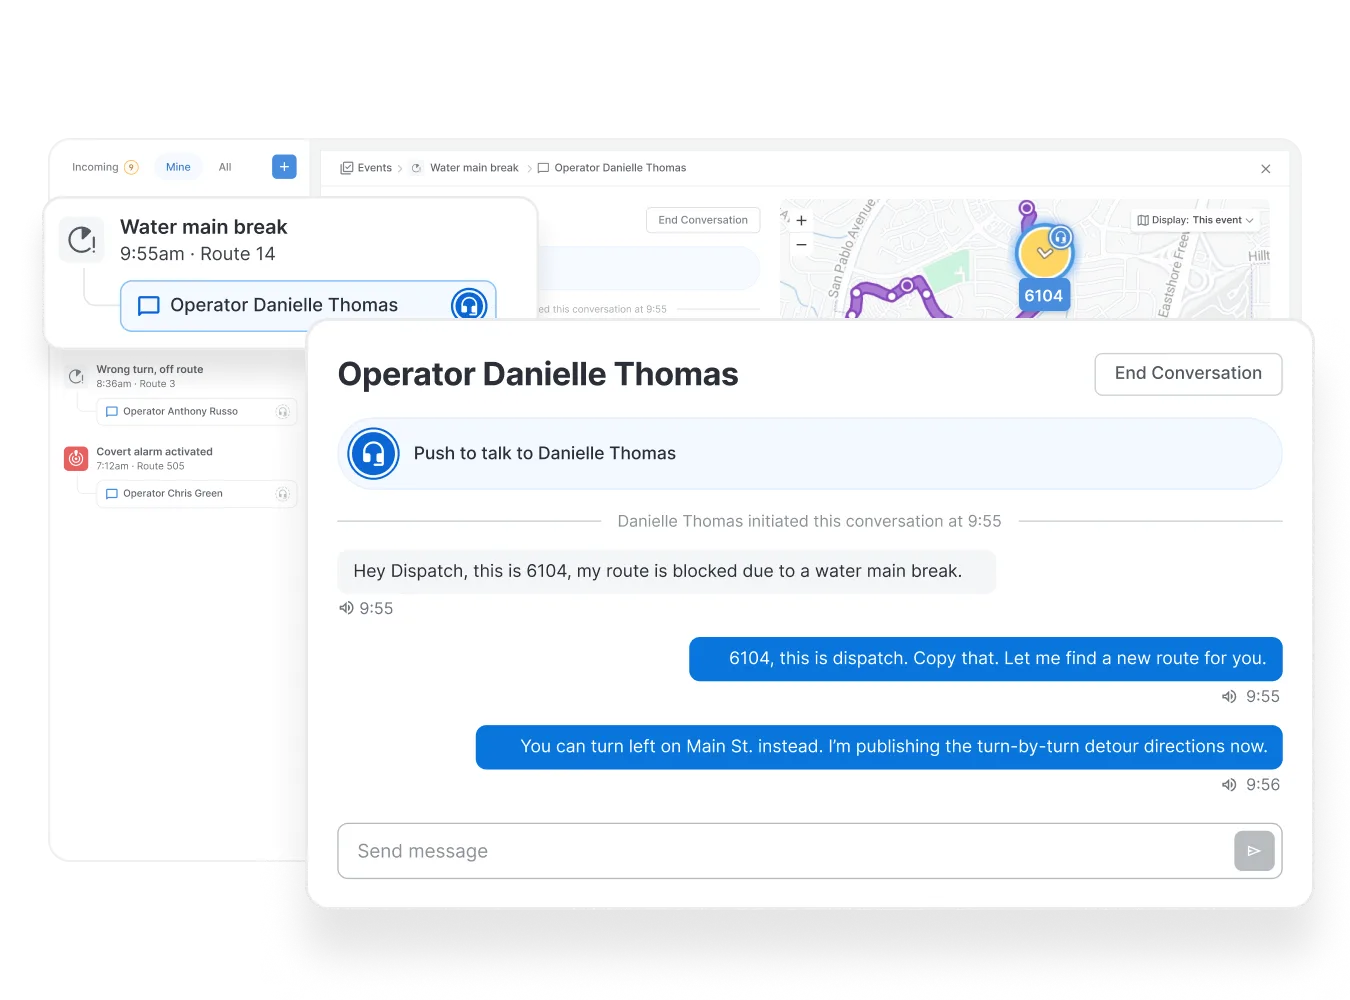
When dispatch reroutes a detour, operators see it in their navigation, field supervisors see it on the map, and customer service sees it in playback, all at once, without anyone making a single phone call.
incident management
Improve week over week, with less paperwork
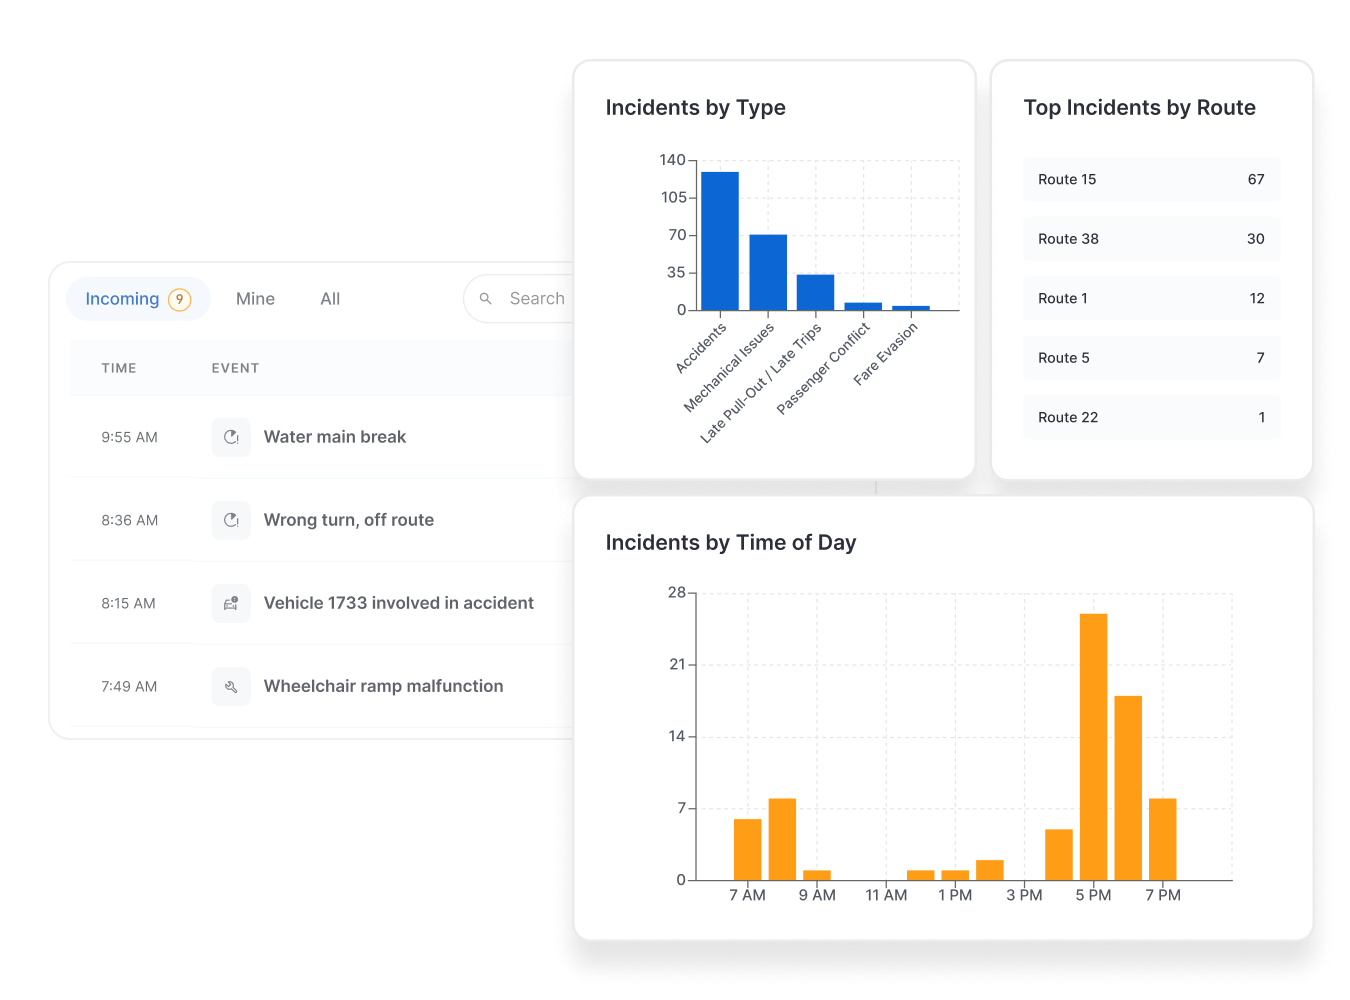
You don’t have to reconstruct what happened from memory at the end of a shift. Every incident is already documented, so next week’s fix is based on what actually happened, not what someone remembers.
CASE STUDIES
Powering the cities that move the world
Transit agencies of all sizes rely on Swiftly’s Transit Data Platform to improve the rider experience, boost service reliability, and operate more efficiently.

TheBus
Swiftly allows our Operations team to work more efficiently, spend less time on data entry, and communicate detours to passengers faster and more accurately.
Sean Paio
,
VP of Transportation

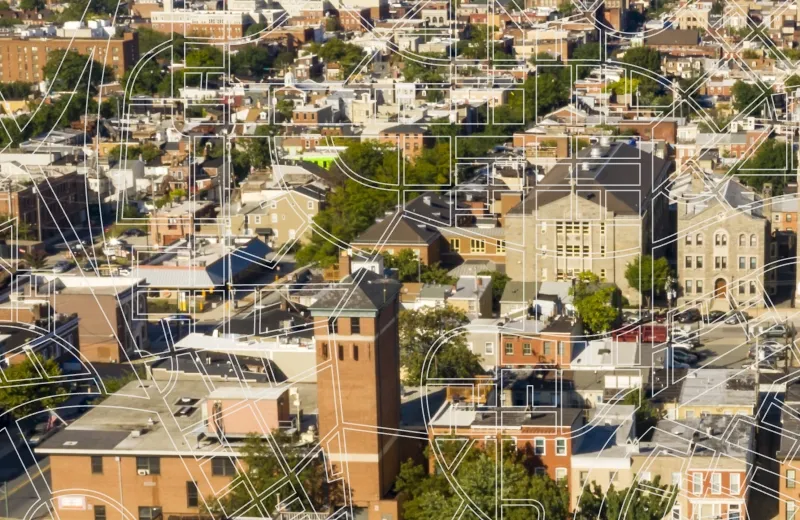
MDOT MTA
Better technology for dispatchers and operators
MDOT MTA improved on-time performance by providing dispatchers and operators with access to real-time performance data, both in the operations center and on the bus.
25%
more likely to be on-time
37%
less likely to be early
20%
drop in early timepoint arrivals

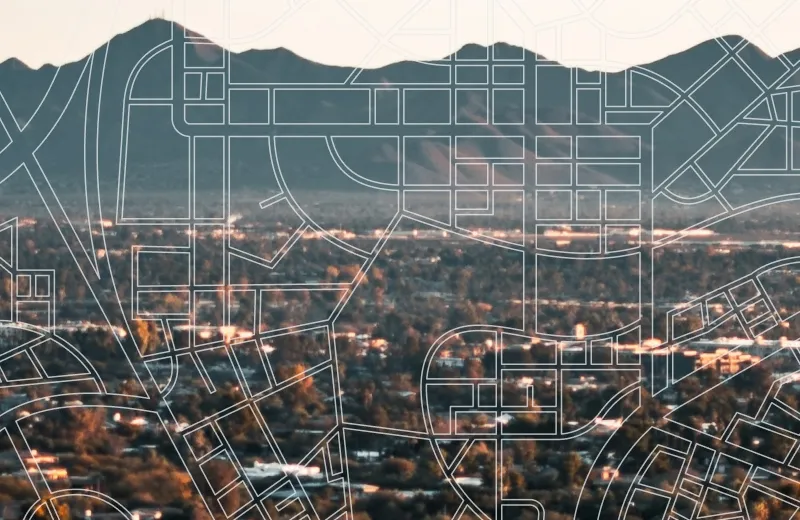
Valley Metro
Historic OTP improvement with proactive operations
Valley Metro equipped dispatchers with real-time performance data and improved system-wide on-time performance (OTP). Swiftly eliminated gaps in missing and inaccurate performance data.
10%
system-wide OTP improvement
25%+
improvement on priority routes
9%
more data captured

MBTA
We are utilizing technology to give our dispatchers and operators the tools to make timely decisions and deliver improved and more reliable travel for our riders.
Phillip Eng
,
General Manager and CEO

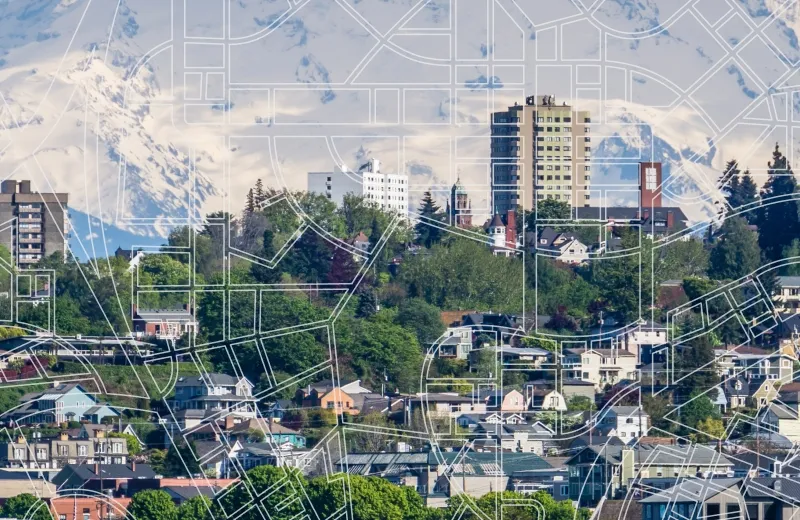
Pierce Transit
Swiftly allowed me to have real-time overview of buses. We can monitor and anticipate where a slowdown is happening. We can catch the problem early on.
Brandon Patacer
,
Service Support Supervisor



CARTA
Enabling dispatchers to proactively manage service
CARTA equipped dispatchers with more efficient tools and reduced the time required for their most common workflows.
66%
less time to correct off-schedule buses
5-7
minutes to resolve rider complaints
600
hours per year saved on operational investigations
This is what a good day actually looks like

Disruption management
When a detour goes out, riders get the update automatically, so your team isn’t fielding the same question twenty times over.
The operator experience
Operators get clear, glanceable guidance instead of a stack of paper and a radio that’s always busy. It’s consistently the tool they’d miss most.

On-time performance
GTFS-rt, APIs, webhooks, and pre-built integrations—get the same trusted data into every tool, app, and screen across your agency.