June 8, 2021
Swiftly and Remix Launch Speed Map Data Layer Integration

Surbi Luhadia
Senior Product Marketing Manager

Swiftly and Remix Launch Partnership
Data is often siloed across teams and software products. We believe bus speed and dwell time data should be more accessible to help push forward projects such as transit priority lanes, stop optimization, transit infrastructure, and before and after studies. This is why Swiftly and Remix are excited to announce that our partnership and integration is now live!
This partnership means you can now visualize Swiftly’s best-in-class historical speed and dwell time data in Remix’s best-in-class planning tool. Swiftly, which works with 100+ agencies, focuses on providing scalable data solutions for fixed-route bus networks, while Remix’s platform empowers thousands of planners to collaborate across multiple stakeholders with the end goal of creating holistic transportation networks. Read more about Swiftly and Remix's partnership as well as how we are working with the Maryland Transportation Administration here.

How the Remix-Swiftly Speed Map Data Layer Works
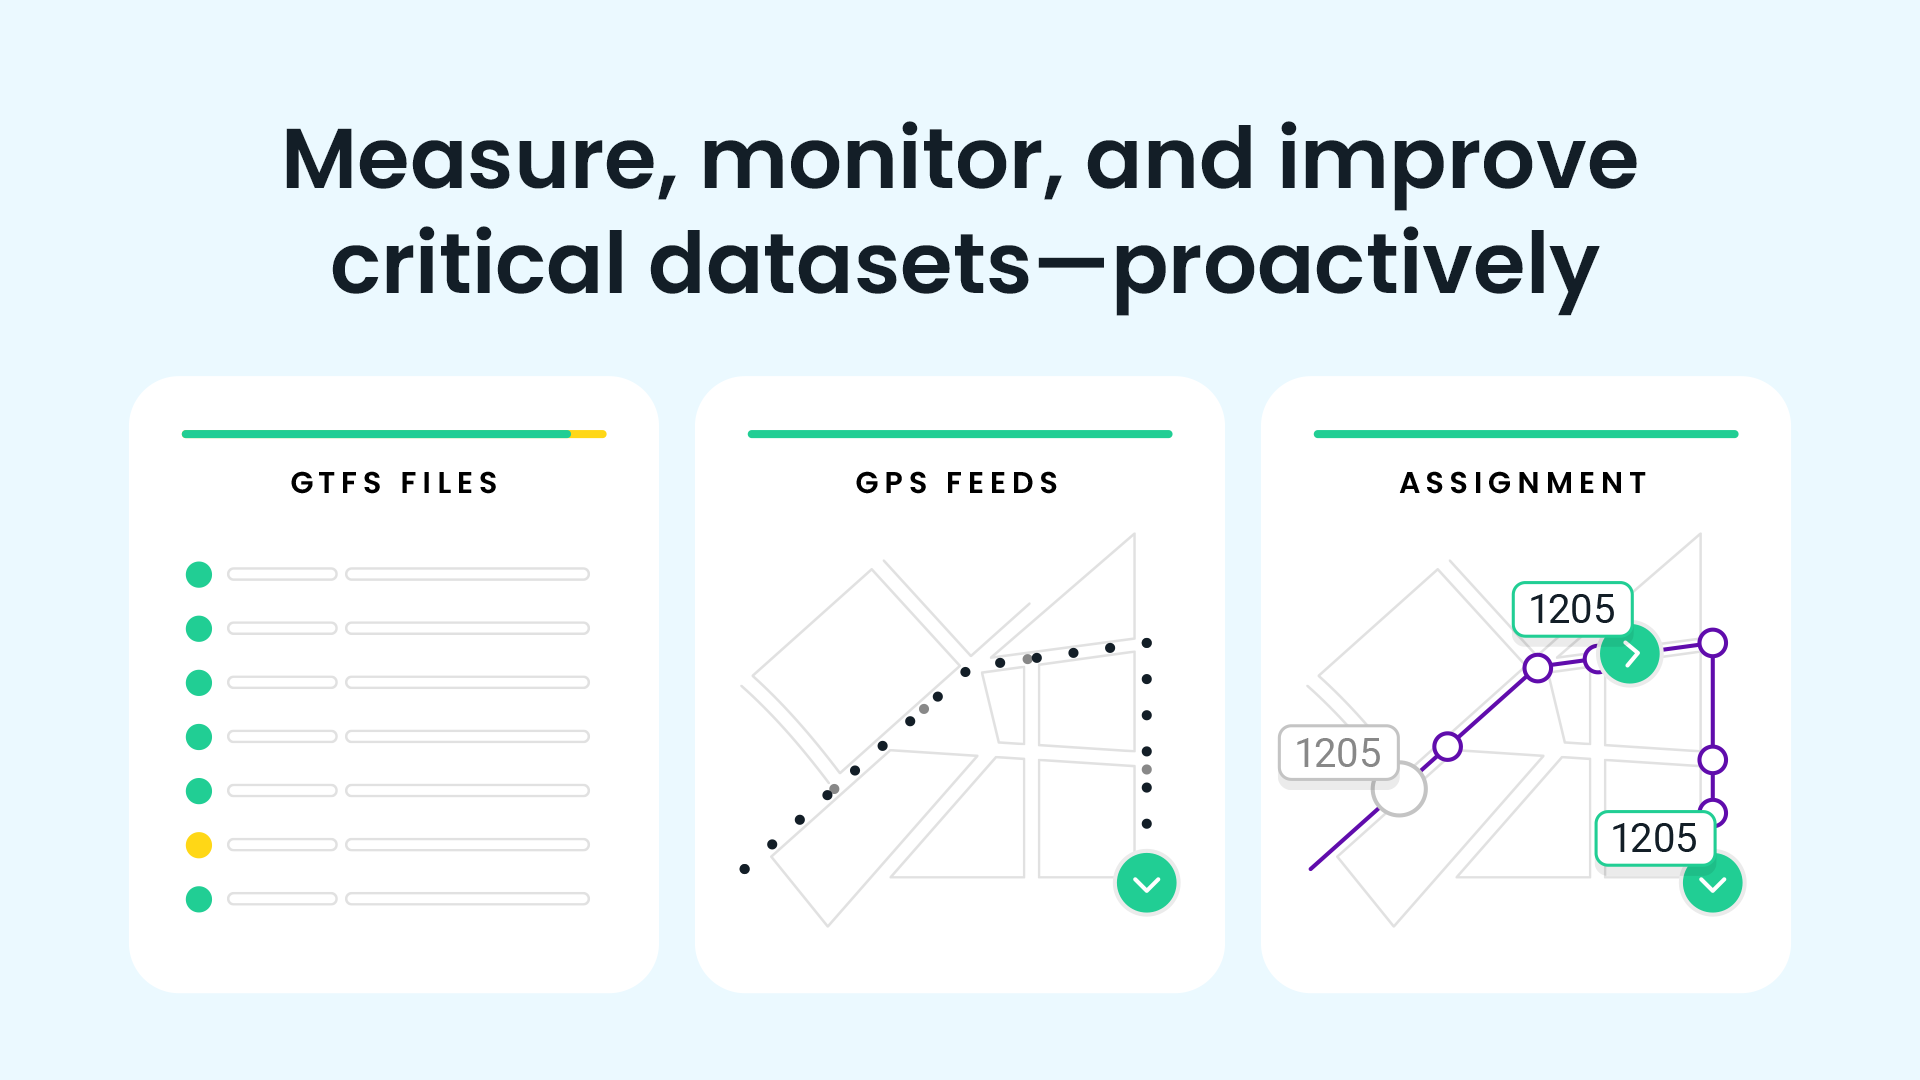
This Data Layer provides an interactive visualization of Swiftly’s Speed Map including historical bus speeds and dwell times within the Remix planning platform. Remix fetches this data dynamically from Swiftly’s APIs, providing you access to data as recent as yesterday and the ability to look at available historic data from any date range and time of day that you’re interested in.
The Data Layer visualizes average speeds and average dwell times for the selected bus lines along a single direction. The speed data is aggregated for stop-to-stop segments across the selected trips, while dwell times are averaged for individual stops.
What our Customers are Saying
“Being able to speak to where your service is getting bogged down (through Swiftly) and show directly how and what groups of riders are impacted by slow speeds (from Remix) helps the agency build a case when speaking with Capital Planning Teams or requesting grant funds,” says Nicholas R. Stewart, Chief of Transit Route Facilities at MDOT MTA.
How You Can Access the Data Layer
We’re excited to announce that all Swiftly Speed Map and Remix customers can access this new feature! To do so, please express your interest by filling out this Interest Form or contact your Customer Success Manager!
Request a demo
The rich text element allows you to create and format headings, paragraphs, blockquotes, images, and video all in one place instead of having to add and format them individually. Just double-click and easily create content.
Last Name, Agency

What’s a Rich Text element?
What’s a Rich Text element?
What’s a Rich Text element?
What’s a Rich Text element?
What’s a Rich Text element?
The rich text element allows you to create and format headings, paragraphs, blockquotes, images, and video all in one place instead of having to add and format them individually. Just double-click and easily create content.
Last Name, Agency
Static and dynamic content editing
A rich text element can be used with static or dynamic content. For static content, just drop it into any page and begin editing. For dynamic content, add a rich text field to any collection and then connect a rich text element to that field in the settings panel. Voila!
How to customize formatting for each rich text
Headings, paragraphs, blockquotes, figures, images, and figure captions can all be styled after a class is added to the rich text element using the "When inside of" nested selector system.
- text goes here
- text goes here
- text goes here
- text goes here
- text goes here
- text goes here


Swiftly, Inc.
2261 Market Street #4151
San Francisco, CA 94114
©2026 Swiftly, Inc. All rights reserved.


It looks like you're located in Spain.
¿Quieres visitar nuestro sitio web en español?
